Unlock a world of possibilities! Login now and discover the exclusive benefits awaiting you.
- Qlik Community
- :
- All Forums
- :
- QlikView App Dev
- :
- QlikView Heat Map
Options
- Subscribe to RSS Feed
- Mark Topic as New
- Mark Topic as Read
- Float this Topic for Current User
- Bookmark
- Subscribe
- Mute
- Printer Friendly Page
Turn on suggestions
Auto-suggest helps you quickly narrow down your search results by suggesting possible matches as you type.
Showing results for
Anonymous
Not applicable
2018-03-09
07:25 AM
- Mark as New
- Bookmark
- Subscribe
- Mute
- Subscribe to RSS Feed
- Permalink
- Report Inappropriate Content
QlikView Heat Map
Hi,
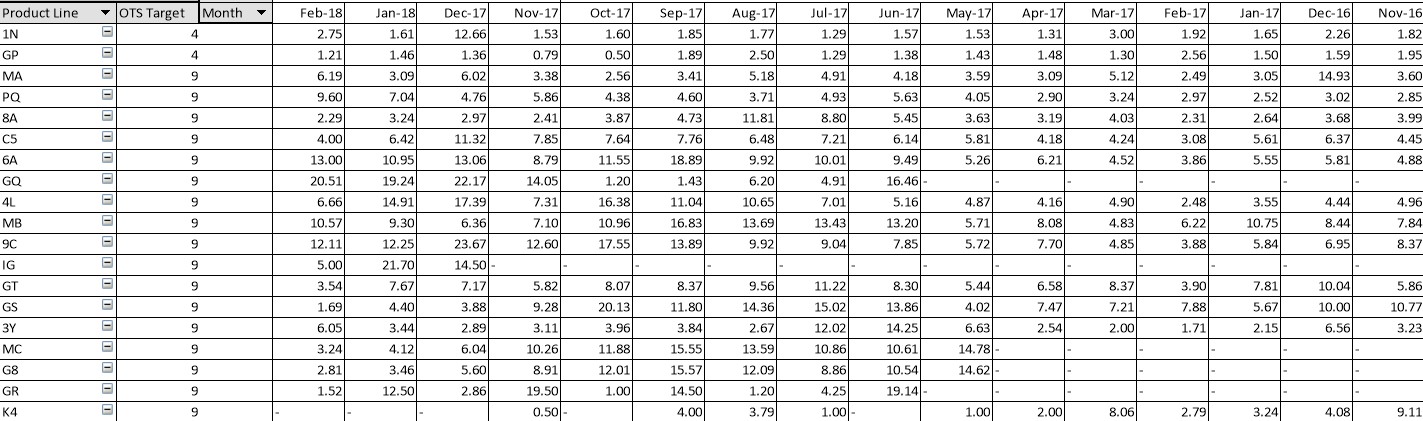
I have created a pivot table which has the following columns;
- Product Line
- OTS Target
- Data Column's by Month
Each Product Line row has a target for measuring performance, which is the guiding factor for color coding for that specific row.
Example;
For Product Line - 6A, OTS Target is 9 days.
Now in that row cell data which is above 9 days need to be colored in 'Red' and cell data less than equal to 9 days need to be colored 'Green', while row cells which have no data should remain as is.
Regards,
Dev
310 Views
2 Replies
Anonymous
Not applicable
2018-03-12
04:14 AM
Author
- Mark as New
- Bookmark
- Subscribe
- Mute
- Subscribe to RSS Feed
- Permalink
- Report Inappropriate Content
Hi,
For each expression or dimension, you can just expand it and write an if statement for the background colour
237 Views
MVP
2018-03-12
04:56 AM
- Mark as New
- Bookmark
- Subscribe
- Mute
- Subscribe to RSS Feed
- Permalink
- Report Inappropriate Content
237 Views