Unlock a world of possibilities! Login now and discover the exclusive benefits awaiting you.
- Qlik Community
- :
- All Forums
- :
- QlikView App Dev
- :
- Re: Qlikview Highlight Min and Max value in Pivot ...
- Subscribe to RSS Feed
- Mark Topic as New
- Mark Topic as Read
- Float this Topic for Current User
- Bookmark
- Subscribe
- Mute
- Printer Friendly Page
- Mark as New
- Bookmark
- Subscribe
- Mute
- Subscribe to RSS Feed
- Permalink
- Report Inappropriate Content
Qlikview Highlight Min and Max value in Pivot table
Hi
Referring to table below, I would like to highlight the background color of variance "Var +/-" for Max value to blue and Min value to yellow for Reportitems3 but was unable to do so. Appreciate it if someone could help. Attached is the sample qvw and excel file for table below.
| CoName | Company1 | Company2 | Company3 | ||||||
| Sep-16 | Sep-15 | Var +/- | Sep-16 | Sep-15 | Var +/- | Sep-16 | Sep-15 | Var +/- | |
| Reportitems1 | 2.4 | 2.5 | (0.1) | 2.6 | 2.6 | 0.0 | 2.8 | 2.9 | (0.1) |
| Reportitems11 | 5.7 | 5.9 | (0.1) | 5.9 | 5.9 | 0.0 | 5.2 | 5.2 | (0.0) |
| Reportitems8 | 3.5 | 3.6 | (0.1) | 3.7 | 3.6 | 0.1 | 2.1 | 2.2 | (0.1) |
| Reportitems2 | 25.5 | 25.7 | (0.1) | 31.1 | 29.1 | 2.0 | 38.1 | 31.4 | 6.7 |
| Reportitems3 | 46.6 | 41.6 | 5.0 | 38.5 | 39.6 | (1.1) | 48.4 | 46.9 | 1.5 |
| Reportitems5 | 14.4 | 15.5 | (1.1) | 14.5 | 15.0 | (0.5) | 13.7 | 17.3 | (3.6) |
| Reportitems6 | 1.4 | 1.4 | (0.0) | 1.7 | 1.6 | 0.1 | 1.8 | 1.9 | (0.1) |
| Reportitems7 | 2.3 | 2.5 | (0.2) | 2.6 | 2.8 | (0.2) | 2.4 | 2.6 | (0.2) |
Accepted Solutions
- Mark as New
- Bookmark
- Subscribe
- Mute
- Subscribe to RSS Feed
- Permalink
- Report Inappropriate Content
May be like this
=If(Reportitems = 'Reportitems3',
If(Column(3) = Max(TOTAL <Reportitems> Aggr(Sum({<Period = {'$(vCurrentQY)'}, Report = {'R2'}>} Amount)-Sum({<Period = {'$(vSelectQY)'}, Report = {'R2'}>} Amount), Reportitems, CoName)), Blue(),
If(Column(3) = Min(TOTAL <Reportitems> Aggr(Sum({<Period = {'$(vCurrentQY)'}, Report = {'R2'}>} Amount)-Sum({<Period = {'$(vSelectQY)'}, Report = {'R2'}>} Amount), Reportitems, CoName)), Yellow())))
- Mark as New
- Bookmark
- Subscribe
- Mute
- Subscribe to RSS Feed
- Permalink
- Report Inappropriate Content
Hi,
To determine the maximum and minimum variation, I've used AGGR.
Max(TOTAL AGGR((Sum({<Period = {'$(vCurrentQY)'}>} Amount)-Sum({<Period = {'$(vSelectQY)'}>} Amount)), CoName, Reportitems))
Once you have this, you can add it to a conditional background color expression as:
=If(
(
Sum({<Period = {'$(vCurrentQY)'}>} Amount)
-
Sum({<Period = {'$(vSelectQY)'}>} Amount)
)
=
Max(TOTAL AGGR((Sum({<Period = {'$(vCurrentQY)'}>} Amount)-Sum({<Period = {'$(vSelectQY)'}>} Amount)), CoName, Reportitems))
,
RGB(83,141,213)
,
If(
(
Sum({<Period = {'$(vCurrentQY)'}>} Amount)
-
Sum({<Period = {'$(vSelectQY)'}>} Amount)
)
=
Min(TOTAL AGGR((Sum({<Period = {'$(vCurrentQY)'}>} Amount)-Sum({<Period = {'$(vSelectQY)'}>} Amount)), CoName, Reportitems))
,
Yellow()
,
NULL()
)
)
I've attached an example, please let me know if this works for you.
With kind regards,
Ronald
- Mark as New
- Bookmark
- Subscribe
- Mute
- Subscribe to RSS Feed
- Permalink
- Report Inappropriate Content
Hi Ronald,
Thank you for your prompt reply. Actually what I wanted is the get the Min and Max variance within the same Row. (ie, Reporttems3 - To highlight background color for company having min or max variance in Reportitems3)
- Mark as New
- Bookmark
- Subscribe
- Mute
- Subscribe to RSS Feed
- Permalink
- Report Inappropriate Content
If else condition works only dimension level not in Metric level. And you are suppose to use specified value for it. It can nod be done. And you are highlighted only for specific values. How you figure out to fix the high light. Only two values you high lighted which called 5.0 and 1.1 Can you elaborate more
- Mark as New
- Bookmark
- Subscribe
- Mute
- Subscribe to RSS Feed
- Permalink
- Report Inappropriate Content
Hi Anil,
Sorry! In my earlier post, I show only 3 companies. In my qvw, I have 5 companies.
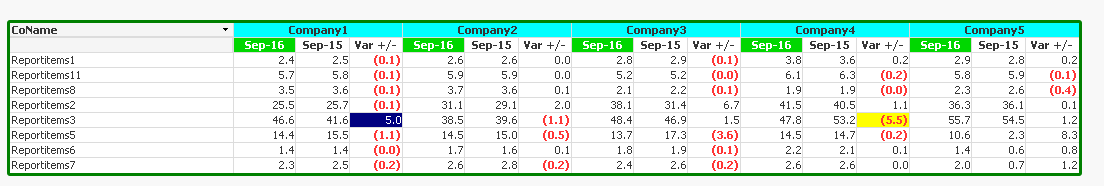
Referring to the table below, what I wanted is the Max and Min for Reportitems3.
In this case, Company1 has the Max variance of 5.0 (highlight Blue) while company4 has min variance of (5.5) (Highlight Yellow)
| CoName | Company1 | Company2 | Company3 | Company4 | Company5 | ||||||||||
| Sep-16 | Sep-15 | Var +/- | Sep-16 | Sep-15 | Var +/- | Sep-16 | Sep-15 | Var +/- | Sep-16 | Sep-15 | Var +/- | Sep-16 | Sep-15 | Var +/- | |
| Reportitems3 | 46.6 | 41.6 | 5.0 | 38.5 | 39.6 | (1.1) | 48.4 | 46.9 | 1.5 | 47.8 | 53.2 | (5.5) | 55.7 | 54.5 | 1.2 |
- Mark as New
- Bookmark
- Subscribe
- Mute
- Subscribe to RSS Feed
- Permalink
- Report Inappropriate Content
Like this?
=If( Column(3)= Max(TOTAL AGGR((Sum({<Period = {'$(vCurrentQY)'}>} Amount)-Sum({<Period = {'$(vSelectQY)'}>} Amount)), CoName, Reportitems)) , Blue() ,
If( Column(3)= Min(TOTAL AGGR((Sum({<Period = {'$(vCurrentQY)'}>} Amount)-Sum({<Period = {'$(vSelectQY)'}>} Amount)), CoName, Reportitems)) , Yellow() ,White() ))

And, I've changed you format to #,##0.00
- Mark as New
- Bookmark
- Subscribe
- Mute
- Subscribe to RSS Feed
- Permalink
- Report Inappropriate Content
Hi Anil,
This produce the same result as Ronald solution. It gives the Min and Max based on all the reportitems in the table. What I want is to get the min and max by individual reportitems row. For this instance, min and max for Reportitem3.
- Mark as New
- Bookmark
- Subscribe
- Mute
- Subscribe to RSS Feed
- Permalink
- Report Inappropriate Content
Yes, That's how I've mentioned Row level won't possible by using direct help
May be look How to use - Dimensionality()
May be this helps
- Mark as New
- Bookmark
- Subscribe
- Mute
- Subscribe to RSS Feed
- Permalink
- Report Inappropriate Content
May be like this
=If(Reportitems = 'Reportitems3',
If(Column(3) = Max(TOTAL <Reportitems> Aggr(Sum({<Period = {'$(vCurrentQY)'}, Report = {'R2'}>} Amount)-Sum({<Period = {'$(vSelectQY)'}, Report = {'R2'}>} Amount), Reportitems, CoName)), Blue(),
If(Column(3) = Min(TOTAL <Reportitems> Aggr(Sum({<Period = {'$(vCurrentQY)'}, Report = {'R2'}>} Amount)-Sum({<Period = {'$(vSelectQY)'}, Report = {'R2'}>} Amount), Reportitems, CoName)), Yellow())))
- Mark as New
- Bookmark
- Subscribe
- Mute
- Subscribe to RSS Feed
- Permalink
- Report Inappropriate Content
Hi Sunny,
Great!! You are a genius. This is exactly what I wanted. Thank You.
Ronald and Anil,
Thank you for your time in looking into this.
Rgds,
Low