Unlock a world of possibilities! Login now and discover the exclusive benefits awaiting you.
- Qlik Community
- :
- All Forums
- :
- QlikView App Dev
- :
- Qlikview set analysis in chart expression based on...
- Subscribe to RSS Feed
- Mark Topic as New
- Mark Topic as Read
- Float this Topic for Current User
- Bookmark
- Subscribe
- Mute
- Printer Friendly Page
- Mark as New
- Bookmark
- Subscribe
- Mute
- Subscribe to RSS Feed
- Permalink
- Report Inappropriate Content
Qlikview set analysis in chart expression based on different column
I have a chart showing Issued Qty for all transactions from 'From Location' to 'To Location' as follows.
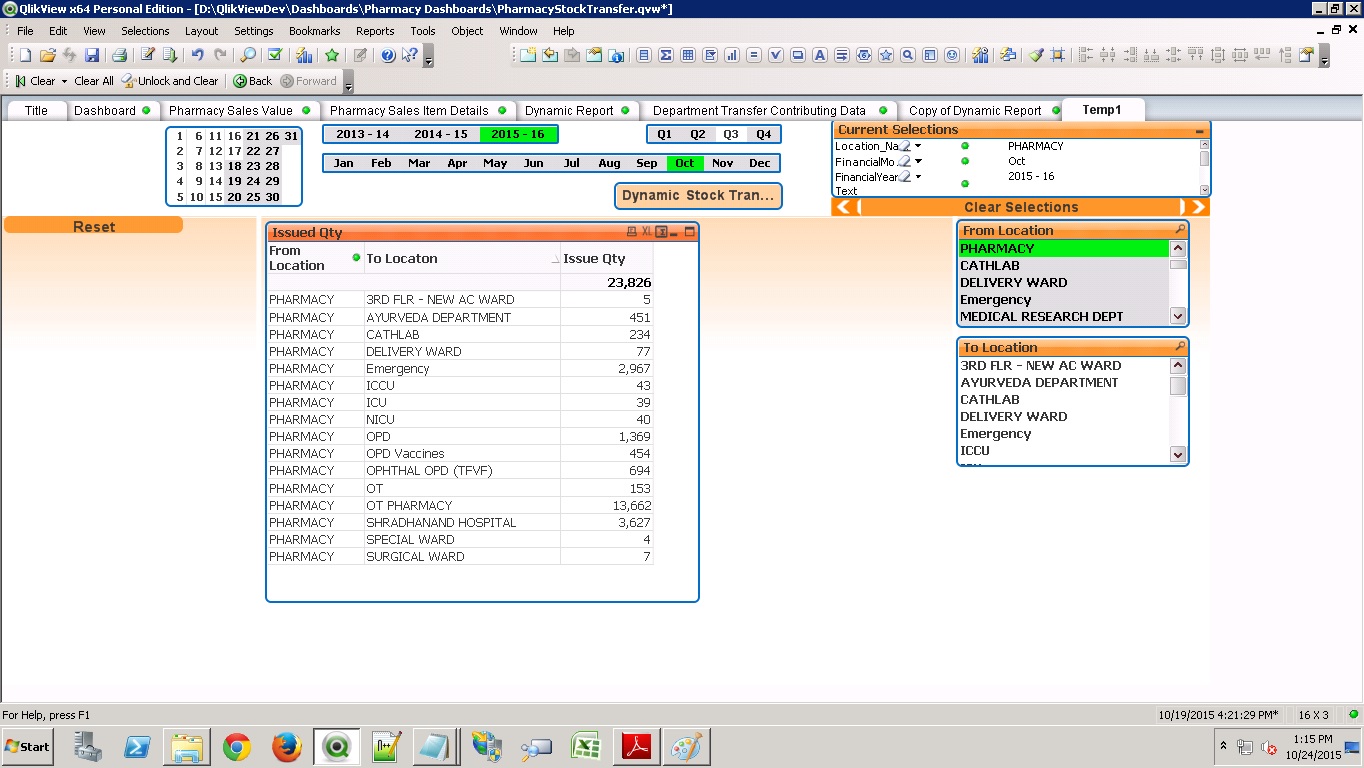
Now I want to show one more column. In that I want to show transaction qty from 'To Location' to 'From Location'. To elaborate, the first row shows Qty issued from Pharmacy to '3rd Flr - NEW AC WARD'. So now in the next column, I wish to show the qtys issued from '3rd Flr - NEW AC WARD' to pharmacy.
Some trick using set analysis would do, but I am not well versed with Set analysis. Please kindly help.
- Mark as New
- Bookmark
- Subscribe
- Mute
- Subscribe to RSS Feed
- Permalink
- Report Inappropriate Content
Set Analysis probably won't help, since it's evaluated once per chart, not per dimension row.
Since your two dimensions already filter the data, it's quite hard to get a different filter for From / To Location in a second column.
I think it would be best to review your data model if there can be something changed to assist your kind of analysis.
Could you upload a small sample QVW?