Unlock a world of possibilities! Login now and discover the exclusive benefits awaiting you.
- Qlik Community
- :
- All Forums
- :
- QlikView App Dev
- :
- RangeSum Chart with Calculated Dimensions?
- Subscribe to RSS Feed
- Mark Topic as New
- Mark Topic as Read
- Float this Topic for Current User
- Bookmark
- Subscribe
- Mute
- Printer Friendly Page
- Mark as New
- Bookmark
- Subscribe
- Mute
- Subscribe to RSS Feed
- Permalink
- Report Inappropriate Content
RangeSum Chart with Calculated Dimensions?
Hi All,
I am trying to find some information of how to display a table with a RangeSum expression and a calculated dimensions in a chart. I've searched the community pages and on twitter with no luck so far.
The table shows a range sum expression calculating the running average value per group by the calculated dimension of Week and Group. (variables altered for privacy) The table shows the correctly calculated data however, when I convert this into a chart, the values are not displayed correctly - see screenshots and detail below.
Expression
=RangeSum(Above(TOTAL sum({<
/
RangeSum(Above(TOTAL Count(DISTINCT(C)),0,RowNo(TOTAL)))
Dimensions
Weeks
=if(([Creation Date]-[Date])/7<0,0,
if(isnull([Creation Date]-[Date]),0,Round(([Creation Date]-[Date])/7)))
Group
=if(Match(Group,'1','2','3'),Group)
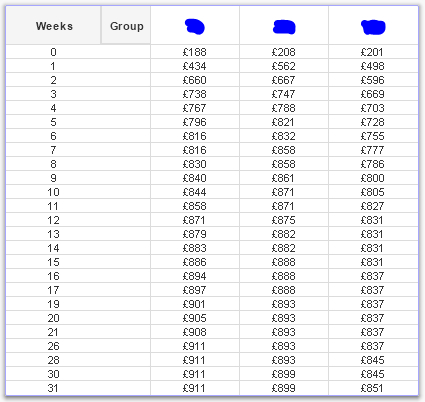
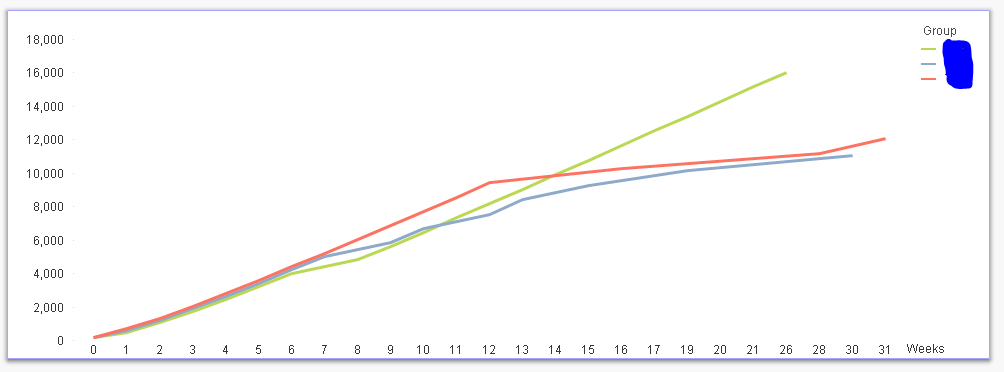
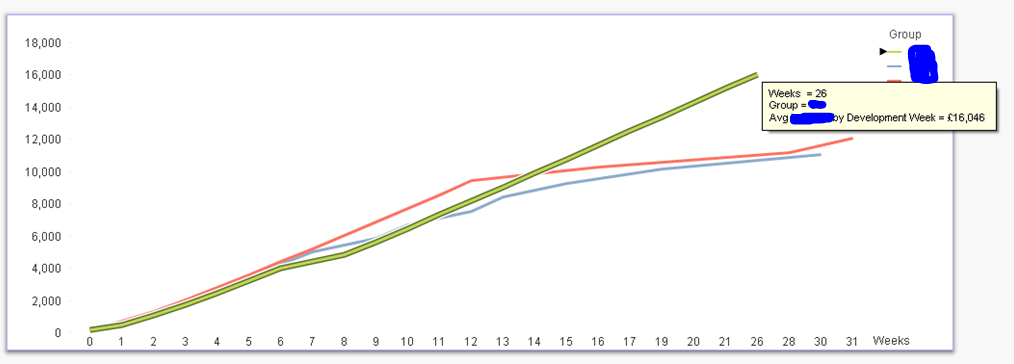
Chart shows correct weeks and groups but the expression values are not in line with the correct values that are shown in the table - see axes from £0 - £18,000 - Summing the values rather than the rangesum.
Any help on this would be greatly appreciated 
Thanks all!
Rachel
- « Previous Replies
-
- 1
- 2
- Next Replies »
- Mark as New
- Bookmark
- Subscribe
- Mute
- Subscribe to RSS Feed
- Permalink
- Report Inappropriate Content
You changed the expression I gave you . You will have to use this:
=Aggr(RangeSum(Above(sum(Value),0,RowNo()))
/
RangeSum(Above(Count(DISTINCT(Concat)),0,RowNo())), Group, (Weeks, (Numeric)))
Not going to work without Aggr() I am afraid
- Mark as New
- Bookmark
- Subscribe
- Mute
- Subscribe to RSS Feed
- Permalink
- Report Inappropriate Content
Thanks! could you please include the qvw?
I have 'no data to display' in the chart with the AGGR() expression.
R
- Mark as New
- Bookmark
- Subscribe
- Mute
- Subscribe to RSS Feed
- Permalink
- Report Inappropriate Content
If you open this link, you will see the qvw attached with my previous response
- Mark as New
- Bookmark
- Subscribe
- Mute
- Subscribe to RSS Feed
- Permalink
- Report Inappropriate Content
Thanks - your attached qvw is the same though - 'no data to display'
- Mark as New
- Bookmark
- Subscribe
- Mute
- Subscribe to RSS Feed
- Permalink
- Report Inappropriate Content
I have asked this (mentioned it) couple of times about the version of QlikView you have. I think you don't have QV12 and my solution will only work in QV12. For anything below QV12, you will have to fix the order of Week field in the script to make this to work.
New Script
Temp:
LOAD RowNo() - 1 as Weeks
AutoGenerate 10000;
LOAD Concat,
Group,
Type,
[Creation Date],
Date,
Value,
FN,
(if(([Creation Date]-[Date])/7<0,0,if(isnull([Creation Date]-[Date]),0,Round(([Creation Date]-[Date])/7))))as [Weeks]
FROM
[example rangesum.xlsx]
(ooxml, embedded labels, table is Sheet1);
DROP Table Temp;
Make sure the Temp table create enough Weeks to cover your Weeks from your main table calculation. I have created 10,000 weeks in ascending order just so that we can use the load order from Aggr() function. Later in the script, I drop the temp table.
New expression:
=Aggr(RangeSum(Above(sum(Value),0,RowNo()))
/
RangeSum(Above(Count(DISTINCT(Concat)),0,RowNo())), Group, Weeks)
I am attaching the qvw with my response. Please check it out.
Best,
Sunny
- « Previous Replies
-
- 1
- 2
- Next Replies »