Unlock a world of possibilities! Login now and discover the exclusive benefits awaiting you.
- Qlik Community
- :
- All Forums
- :
- QlikView App Dev
- :
- RangeSum not working as intended in BAR chart.
- Subscribe to RSS Feed
- Mark Topic as New
- Mark Topic as Read
- Float this Topic for Current User
- Bookmark
- Subscribe
- Mute
- Printer Friendly Page
- Mark as New
- Bookmark
- Subscribe
- Mute
- Subscribe to RSS Feed
- Permalink
- Report Inappropriate Content
RangeSum not working as intended in BAR chart.
Hello,
I am fairly new to Qlikview. I have a bar graph with two dimensions (Demand Type and YYYYQ) and one measure on which I am doing a rangesum.
RANGESUM(BELOW(SUM({$<Datatype={'MPDemandsCRSD'}>}BACKLOG_UNIT_QTY),0,RowNo()))
But the rangesum is not working as intended, can you tell me what is missing? As you can see the green portion of the bar should stack up all the way till the last quarter shown (20191) and so is the case with the blue portion of the bar (backlog). It works perfectly in a pivot table.
Thanks in advance.
- Mark as New
- Bookmark
- Subscribe
- Mute
- Subscribe to RSS Feed
- Permalink
- Report Inappropriate Content
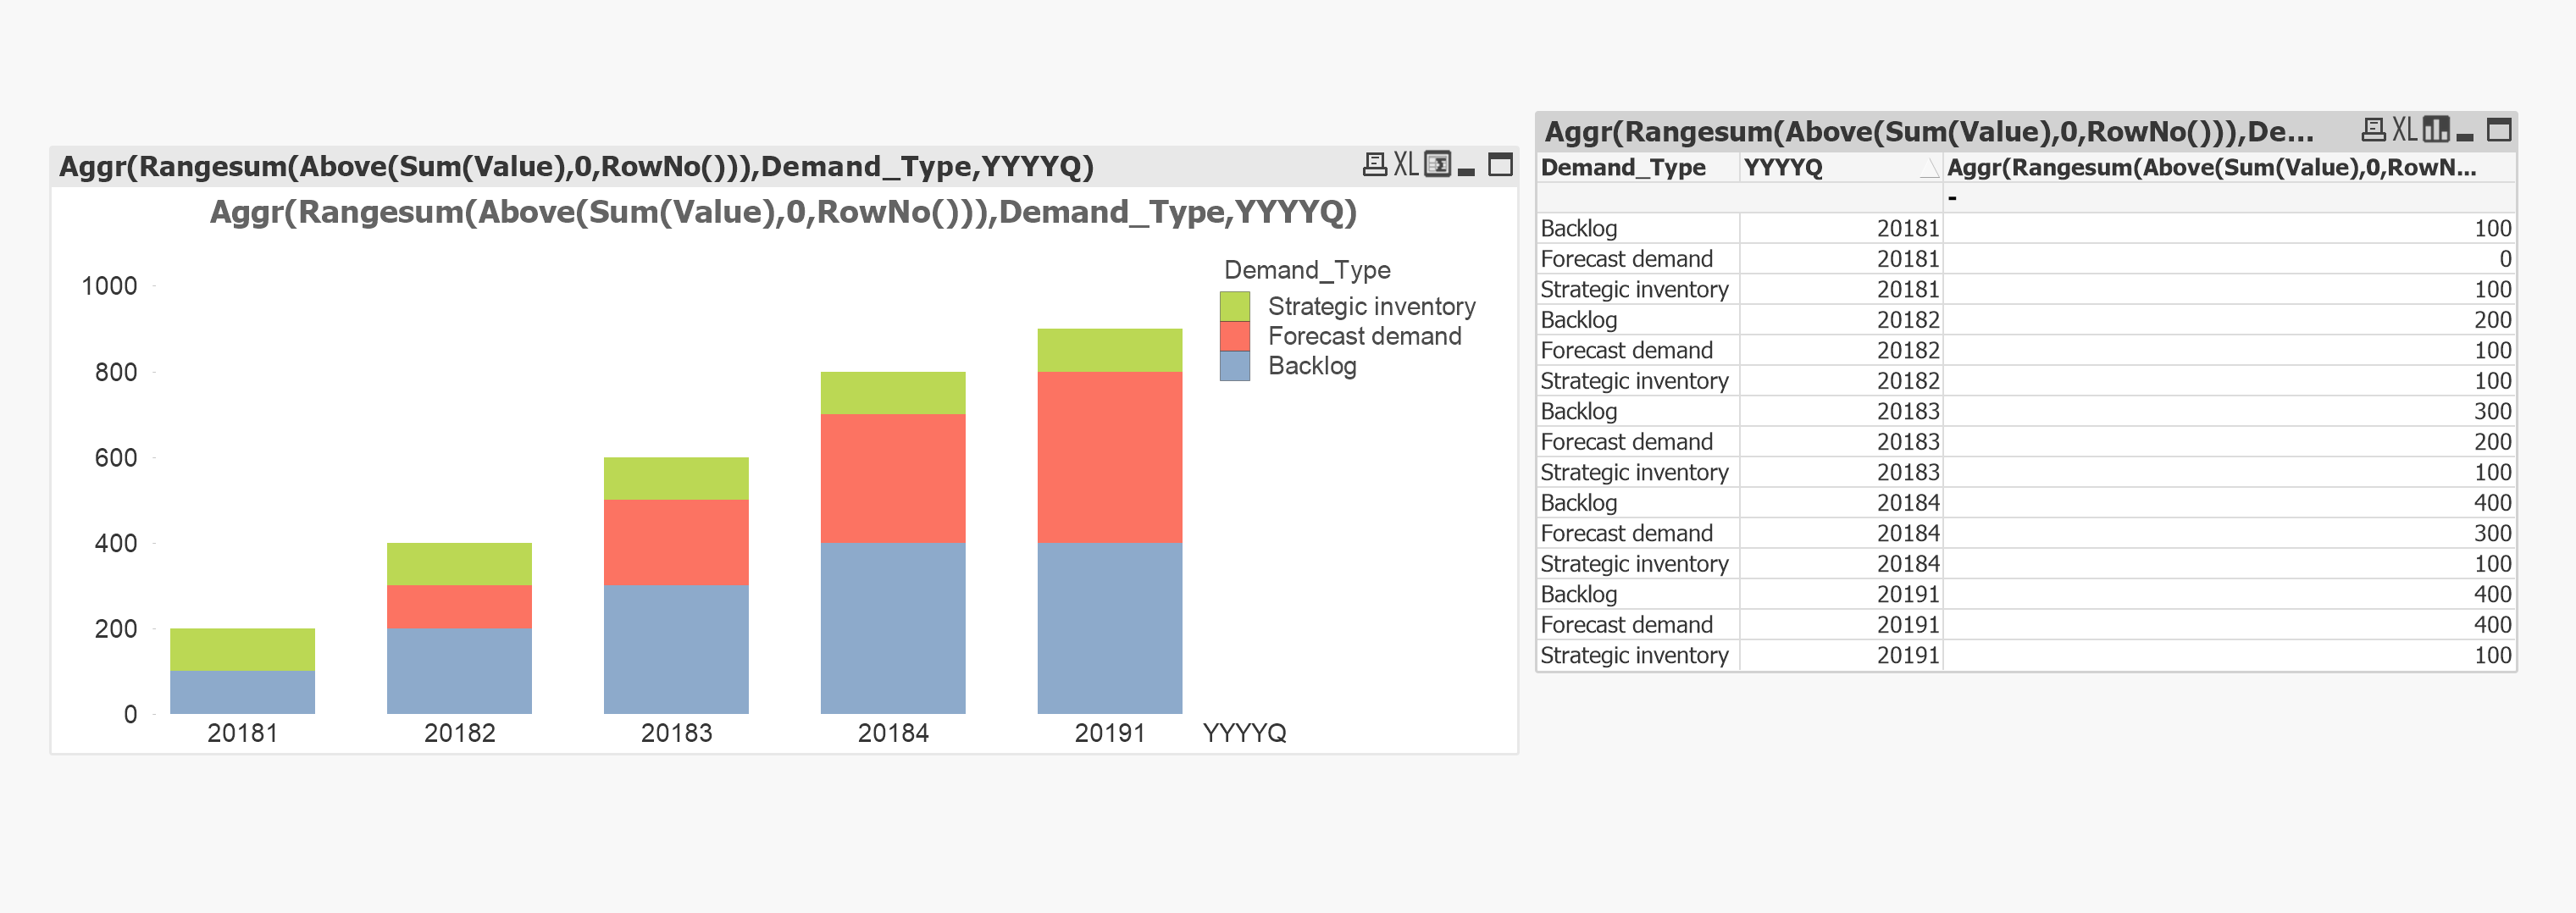
Try this
Aggr(RangeSum(Above(Sum({$<Datatype={'MPDemandsCRSD'}>}BACKLOG_UNIT_QTY), 0, RowNo())), DEMAND_TYPE, YYYYQ)
- Mark as New
- Bookmark
- Subscribe
- Mute
- Subscribe to RSS Feed
- Permalink
- Report Inappropriate Content
Thanks for the quick response and I did try this before I posted and sadly it does not work.
- Mark as New
- Bookmark
- Subscribe
- Mute
- Subscribe to RSS Feed
- Permalink
- Report Inappropriate Content
It might help to know what makes you think it is not working.... numbers are wrong... you see nothing (blank chart).... computer shuts down  ....
....
- Mark as New
- Bookmark
- Subscribe
- Mute
- Subscribe to RSS Feed
- Permalink
- Report Inappropriate Content
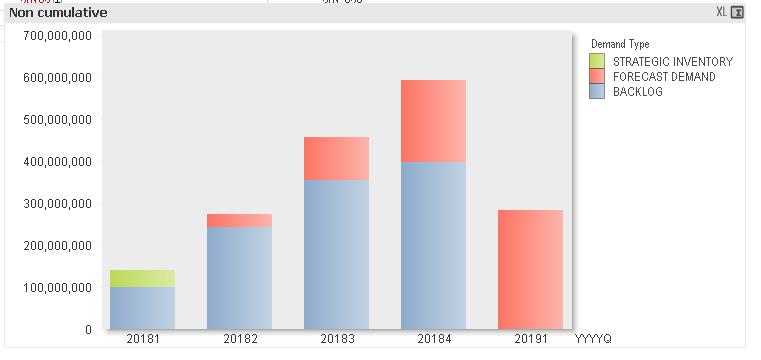
The numbers are wrong and the accumulation is not happening by the demand type.
- Mark as New
- Bookmark
- Subscribe
- Mute
- Subscribe to RSS Feed
- Permalink
- Report Inappropriate Content
How about this
Aggr(RangeSum(Above(Sum({$<Datatype={'MPDemandsCRSD'}>}BACKLOG_UNIT_QTY) + Sum({1} 0), 0, RowNo())), DEMAND_TYPE, YYYYQ)
- Mark as New
- Bookmark
- Subscribe
- Mute
- Subscribe to RSS Feed
- Permalink
- Report Inappropriate Content
Thanks for your quick response Sunny but this had a syntax error and would not work. 
The error was here right after the RowNo()))
Aggr(RANGESUM(Above(SUM({$<Datatype={'MPDemandsCRSD'}>}BACKLOG_UNIT_QTY),+Sum({1}0),0,RowNo())) ,DEMAND_TYPE,YYYYQ)/$(vMetricsSelector)
- Mark as New
- Bookmark
- Subscribe
- Mute
- Subscribe to RSS Feed
- Permalink
- Report Inappropriate Content
Did you accidentally add a comma here?

- Mark as New
- Bookmark
- Subscribe
- Mute
- Subscribe to RSS Feed
- Permalink
- Report Inappropriate Content
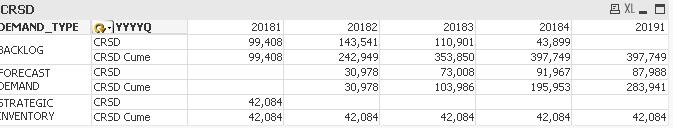
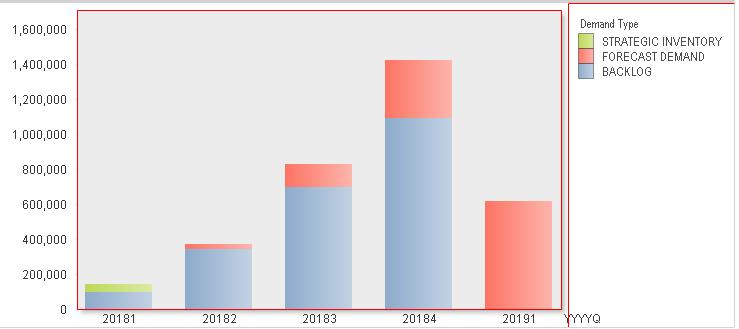
I fixed the typo and this is what I see. The first quarter always is correct and it matches the same pivot table below. Also interestingly if i did a fast change on this bar graph to pivot the values are correct. Only the chart is way off.
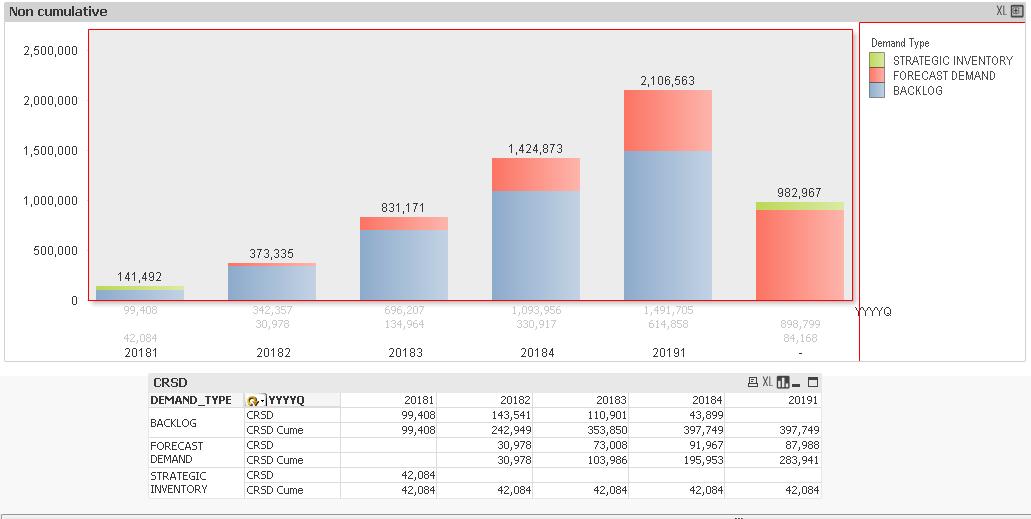
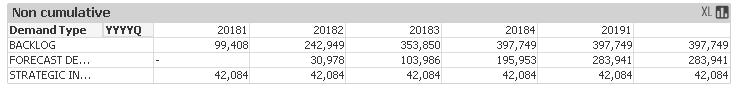
Here is the pivot on the fast change for the same graph:
- Mark as New
- Bookmark
- Subscribe
- Mute
- Subscribe to RSS Feed
- Permalink
- Report Inappropriate Content
Works this way with the sample attached -