Unlock a world of possibilities! Login now and discover the exclusive benefits awaiting you.
- Qlik Community
- :
- All Forums
- :
- QlikView App Dev
- :
- Real life example ... How can I display this in a ...
- Subscribe to RSS Feed
- Mark Topic as New
- Mark Topic as Read
- Float this Topic for Current User
- Bookmark
- Subscribe
- Mute
- Printer Friendly Page
- Mark as New
- Bookmark
- Subscribe
- Mute
- Subscribe to RSS Feed
- Permalink
- Report Inappropriate Content
Real life example ... How can I display this in a chart?
Hi,
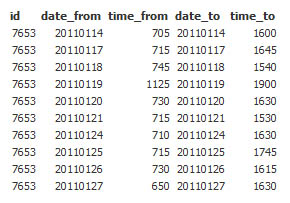
I have a file with lots of dates and times that represents how people work. I would like to visually display this information so I can see how people schedule their time, not as individuals but overall and preferably in a chart. I would like to see the information hour by hour or even better every half-hour over the whole day (24 hours). Below is a an example of how my file look. How can I accomplish this? Any pointers are appreciated...
I don't really know where to start. I am still VERY new to Qlikview.
Thanks
- Mark as New
- Bookmark
- Subscribe
- Mute
- Subscribe to RSS Feed
- Permalink
- Report Inappropriate Content
Hi .....you can get the value by using the pivot table or straight table....
regards
Kamal
- Mark as New
- Bookmark
- Subscribe
- Mute
- Subscribe to RSS Feed
- Permalink
- Report Inappropriate Content
Hi
If you're brand new to QlikView this is a nice example.
Once you have built your script, I would:
- work out how to put it into a Table object - that way you can explore all the data visually, and is fairly easy
- next do something similar with a table in a Chart object - this gives much more flexibility and you can add expressions
- you are likely to need expressions which work out the total time worked each day, also you might want to have an expression for the time slot the start (and end) times are in eg. 7:30 - 8:00 am.
- after that, explore the different chart types - for example, you may need to build a chart which compares hours worked with start time (if someone starts later do they work fewer hours?)
Hope that helps.