Unlock a world of possibilities! Login now and discover the exclusive benefits awaiting you.
- Qlik Community
- :
- All Forums
- :
- QlikView App Dev
- :
- Reducing the thickness of a line chart
- Subscribe to RSS Feed
- Mark Topic as New
- Mark Topic as Read
- Float this Topic for Current User
- Bookmark
- Subscribe
- Mute
- Printer Friendly Page
- Mark as New
- Bookmark
- Subscribe
- Mute
- Subscribe to RSS Feed
- Permalink
- Report Inappropriate Content
Reducing the thickness of a line chart
Hi,
I have a requirement wherein i must display the sum(value) based on month and also display the target value so that the comparison between them could be done.But,then as i am showing both the values using line chart i would want the line that shows the target value to be thinner when compared to the the line that shows the sum(value).I have attached the sample application.
Please let me know how the above requirement could be fulfilled
- Tags:
- new_to_qlikview
Accepted Solutions
- Mark as New
- Bookmark
- Subscribe
- Mute
- Subscribe to RSS Feed
- Permalink
- Report Inappropriate Content
Yes you can change it in the Expression Definition
Set the Line Style with to
'<W0.25>', Sorry, '<W.5>' is the lowest it goes to I think

- Mark as New
- Bookmark
- Subscribe
- Mute
- Subscribe to RSS Feed
- Permalink
- Report Inappropriate Content
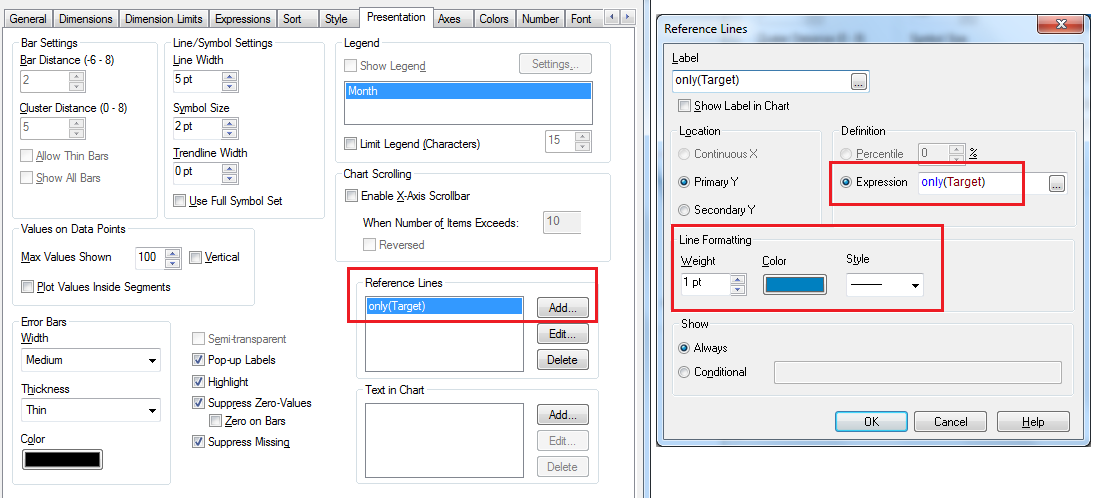
can you pls use the Reference Lines for your target.
- Mark as New
- Bookmark
- Subscribe
- Mute
- Subscribe to RSS Feed
- Permalink
- Report Inappropriate Content
Yes you can change it in the Expression Definition
Set the Line Style with to
'<W0.25>', Sorry, '<W.5>' is the lowest it goes to I think
- Mark as New
- Bookmark
- Subscribe
- Mute
- Subscribe to RSS Feed
- Permalink
- Report Inappropriate Content
Hi Sudeep,
The approach that you have suggested works well but then the reference line does not show the target value on hovering.Is there any way to show the target data on hovering when reference line is used?
- Mark as New
- Bookmark
- Subscribe
- Mute
- Subscribe to RSS Feed
- Permalink
- Report Inappropriate Content
Line Style
Only applicable on line, combo and radar charts. Click on
Line Style in order to enter an attribute expression for calculating
the line style for the line or line segment associated
with the data point.
The relative width of the line can be controlled by including
a tag <Wn> where n is a multiplying factor to be applied
on the default line width of the chart. The number n must be
a real number between 0.5 and 8. Example: <W2.5>.
The style of the line can be controlled by including a tag
<Sn> where n is an integer between 1 and 4 indicating the
style to be used (1=continous, 2= dashed, 3=dotted,
4=dashed/dotted). Example: <S3>.
The <Wn> and <Sn> tags can be freely combined, but only
the first occurrence of each counts. The tags must be
enclosed by single quotations.
I n the only(target ) expression go to line style & enter the following in to definition '<W0.5>' which is thinner from 0.5 to 8 u can enter any value but 0.5 is best thinner and remove only(target) in line style definition
- Mark as New
- Bookmark
- Subscribe
- Mute
- Subscribe to RSS Feed
- Permalink
- Report Inappropriate Content
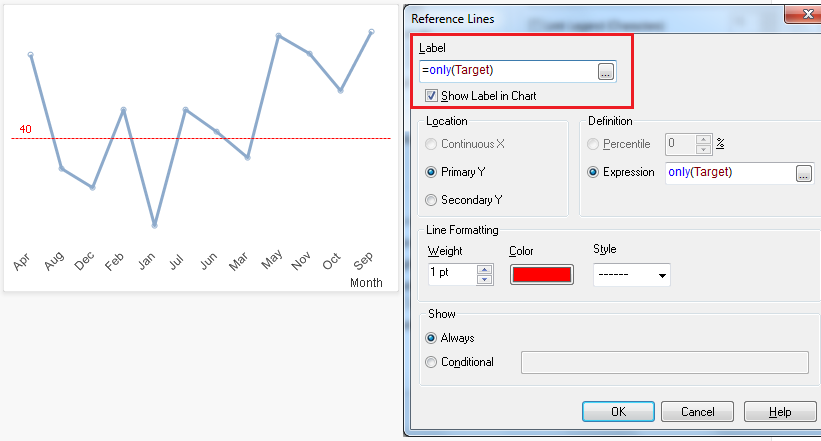
I'm not sure if you can hover over and see the Target value while using reference lines, but you may use the Show Label option available in the Reference Lines. Most of the time the Target value is same throughout the dimension so you can just show the Target value in the chart using the label option. As shown below 40 is the Target value and is visible on the chart. sometimes when your Target values and the actual value are almost same then there are chances of overlap. You can also change the Target line style and color using other options available under Reference lines. You can also use a combination of Reference line and Text in Chart so show your target values.
- Mark as New
- Bookmark
- Subscribe
- Mute
- Subscribe to RSS Feed
- Permalink
- Report Inappropriate Content
Thanks Gokul the explaination provided is very informative
- Mark as New
- Bookmark
- Subscribe
- Mute
- Subscribe to RSS Feed
- Permalink
- Report Inappropriate Content
Thanks for the solution provided.this very much serves the purpose
- Mark as New
- Bookmark
- Subscribe
- Mute
- Subscribe to RSS Feed
- Permalink
- Report Inappropriate Content
hmm ok can u accept my request