Unlock a world of possibilities! Login now and discover the exclusive benefits awaiting you.
- Qlik Community
- :
- All Forums
- :
- QlikView App Dev
- :
- Re: Removing row based on expression
- Subscribe to RSS Feed
- Mark Topic as New
- Mark Topic as Read
- Float this Topic for Current User
- Bookmark
- Subscribe
- Mute
- Printer Friendly Page
- Mark as New
- Bookmark
- Subscribe
- Mute
- Subscribe to RSS Feed
- Permalink
- Report Inappropriate Content
Removing row based on expression
Hi all,
I have an aggregated expression to determine the number of stores our clients have. Now I want to filter this, that all store-counts < 5 are not visible. But instead of showing - or 0 or null, I want the row to disappear. How can I do this?
Kind Regards,
Maarten
Accepted Solutions
- Mark as New
- Bookmark
- Subscribe
- Mute
- Subscribe to RSS Feed
- Permalink
- Report Inappropriate Content
Then you have to add the below line for all your 15 expressions. So that all the expressions will show null for the specific dimension and chart will not display the row.
If(storecount>5, Expression1)
- Mark as New
- Bookmark
- Subscribe
- Mute
- Subscribe to RSS Feed
- Permalink
- Report Inappropriate Content
try like:
=if(aggr(count(StoreID), Client)>=5, Client).......
it will give you only those Clients whose stores are equal or more than 5
- Mark as New
- Bookmark
- Subscribe
- Mute
- Subscribe to RSS Feed
- Permalink
- Report Inappropriate Content
Hi Maarten,
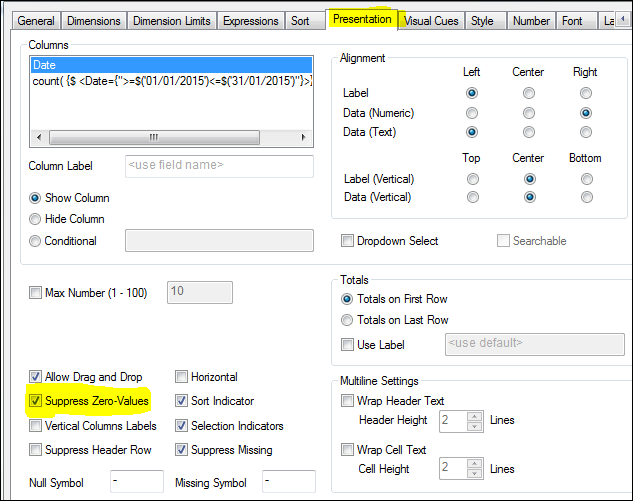
You can use suppress null values option in presentation tab.
- Mark as New
- Bookmark
- Subscribe
- Mute
- Subscribe to RSS Feed
- Permalink
- Report Inappropriate Content
Check 'Supress When Value is Null' in the dimension tab.
- Mark as New
- Bookmark
- Subscribe
- Mute
- Subscribe to RSS Feed
- Permalink
- Report Inappropriate Content
Yeah I know, but it isn't working, since I have more expressions running about.... I was hoping for a simple solution instead of giving about 15 expressions an if(storecount >5), ... calculation.
- Mark as New
- Bookmark
- Subscribe
- Mute
- Subscribe to RSS Feed
- Permalink
- Report Inappropriate Content
If you use the condition in the dimension (use calculated dimension), it should work. Could you post a sample qvw?
- Mark as New
- Bookmark
- Subscribe
- Mute
- Subscribe to RSS Feed
- Permalink
- Report Inappropriate Content
Then you have to add the below line for all your 15 expressions. So that all the expressions will show null for the specific dimension and chart will not display the row.
If(storecount>5, Expression1)
- Mark as New
- Bookmark
- Subscribe
- Mute
- Subscribe to RSS Feed
- Permalink
- Report Inappropriate Content
Unfortunately, this was it. Thank you all anyways!