Unlock a world of possibilities! Login now and discover the exclusive benefits awaiting you.
- Qlik Community
- :
- All Forums
- :
- QlikView App Dev
- :
- Right align Y-axis dimension in Grid Chart
- Subscribe to RSS Feed
- Mark Topic as New
- Mark Topic as Read
- Float this Topic for Current User
- Bookmark
- Subscribe
- Mute
- Printer Friendly Page
- Mark as New
- Bookmark
- Subscribe
- Mute
- Subscribe to RSS Feed
- Permalink
- Report Inappropriate Content
Right align Y-axis dimension in Grid Chart
Hello Team,
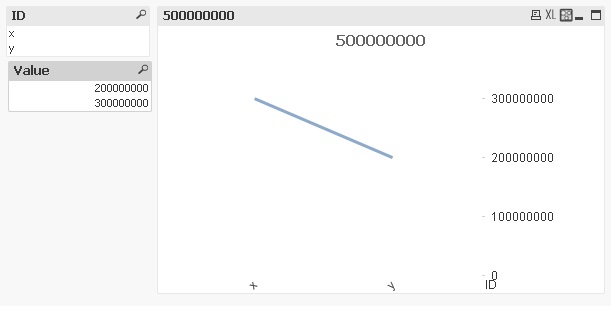
I am using a Grid Chart. The Y axis dimension values are getting truncated. I even tried with Shift+Ctrl but no luck.
Currently it shows only first 2 characters of text (rest are truncated)
Is there any way to make the text as right aligned? Something similar to "Truncate Label" that we have in Bar or Line chart.
Thanks
Accepted Solutions
- Mark as New
- Bookmark
- Subscribe
- Mute
- Subscribe to RSS Feed
- Permalink
- Report Inappropriate Content
Hi,
Not able to find the option. for me the Calculated dimension work. Like
=[Practice Area]&chr(10)

- Mark as New
- Bookmark
- Subscribe
- Mute
- Subscribe to RSS Feed
- Permalink
- Report Inappropriate Content
Hi,
Do you want something like this?
Regards,
Neha
- Mark as New
- Bookmark
- Subscribe
- Mute
- Subscribe to RSS Feed
- Permalink
- Report Inappropriate Content
Hi Neha,
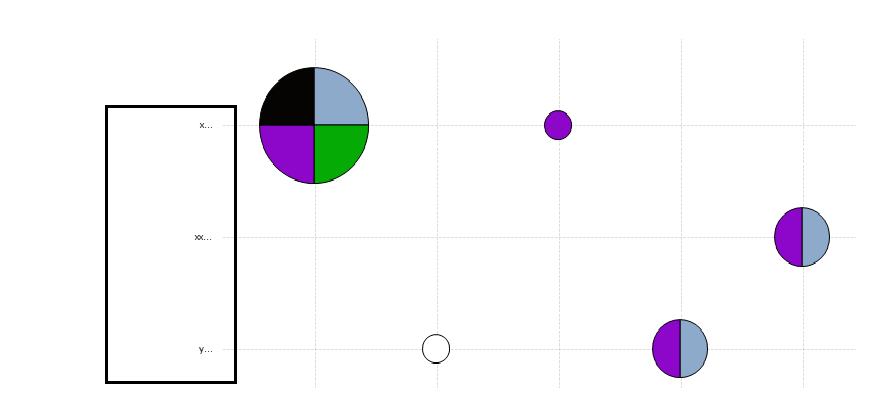
If you see below, y-axis dimension values are not getting displayed properly. It just shows first 1-2 character, rest is hidden.
I want to make these (highlighted in black box) entire text to be visible in the same location
- Mark as New
- Bookmark
- Subscribe
- Mute
- Subscribe to RSS Feed
- Permalink
- Report Inappropriate Content
Can you please share your file.
Mostly ctrl+shift and arrow works.
You can either increase the width of your chart.
- Mark as New
- Bookmark
- Subscribe
- Mute
- Subscribe to RSS Feed
- Permalink
- Report Inappropriate Content
Hi Neha,
Please find the attached file.
For security reasons I have deleted contents from Edit script.
can you please guide me how we can show the full text in y dimensions.
Thanks
- Mark as New
- Bookmark
- Subscribe
- Mute
- Subscribe to RSS Feed
- Permalink
- Report Inappropriate Content
Hi,
Not able to find the option. for me the Calculated dimension work. Like
=[Practice Area]&chr(10)