Unlock a world of possibilities! Login now and discover the exclusive benefits awaiting you.
- Qlik Community
- :
- All Forums
- :
- QlikView App Dev
- :
- Re: Rollig 12 Months in Bar chart
- Subscribe to RSS Feed
- Mark Topic as New
- Mark Topic as Read
- Float this Topic for Current User
- Bookmark
- Subscribe
- Mute
- Printer Friendly Page
- Mark as New
- Bookmark
- Subscribe
- Mute
- Subscribe to RSS Feed
- Permalink
- Report Inappropriate Content
Rollig 12 Months in Bar chart
Hi All,
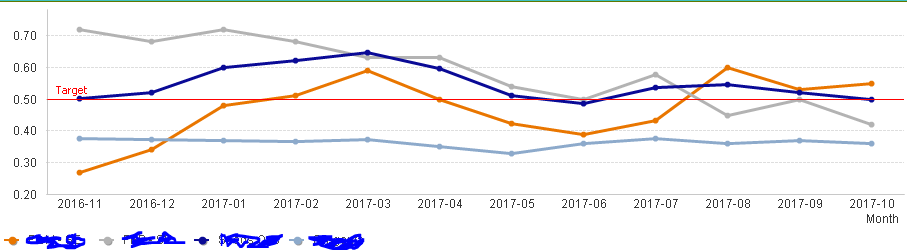
I have created a chart for Rolling 12 months on month and function as dimension below
Expression is
=Num(Sum({<Region={'Global'},DateMonth ={">$(=Date(AddMonths(vMaxDate_IIR,-12),'YYYY-MM')) <=$(vMaxDate_IIR)"}>} YTD), '##.##')
But it is showing Respective Month Value not the rolling 12 months for every line
Checked Dates and giving correct value ---- Date(AddMonths(vMaxDate_IIR,-12),'YYYY-MM') and to ---vMaxDate_IIR
When i tried expression with text box and giving selections accordingly it is giving rolling 12 months value
Please suggest me on this.
Thanks in advance
- « Previous Replies
-
- 1
- 2
- Next Replies »
Accepted Solutions
- Mark as New
- Bookmark
- Subscribe
- Mute
- Subscribe to RSS Feed
- Permalink
- Report Inappropriate Content
If you have 4 Expressions, then you need to change all of them in the same way.
If you only have one Expression and two Dimension, then add the second Dimension in the aggr function like this.
Num(Sum({<Region={'Global'},DateMonth ={">$(=Date(AddMonths(vMaxDate_IIR,-12),'YYYY-MM')) <=$(vMaxDate_IIR)"}>}
aggr(RangeSum(above(sum(YTD),0,12)),DateMonth,dimension2)), '##.##')
- Mark as New
- Bookmark
- Subscribe
- Mute
- Subscribe to RSS Feed
- Permalink
- Report Inappropriate Content
In your way, What do you mean the "Rolling 12 Months"??
- Mark as New
- Bookmark
- Subscribe
- Mute
- Subscribe to RSS Feed
- Permalink
- Report Inappropriate Content
Chart shows recent 12 months(Considering max date as 2017-10)
if you see in chart first date is
2016-11------value for this should be from 2015-12 to 2016-11
-
-
2017-10-----value for this should be from 2016-11 to 2017-10
- Mark as New
- Bookmark
- Subscribe
- Mute
- Subscribe to RSS Feed
- Permalink
- Report Inappropriate Content
Hi,
{">$(=Date(AddMonths(vMaxDate_IIR,-12),'YYYY-MM'
if you add >= in the beginning of set analysis maybe.
{">=$(=Date(AddMonths(vMaxDate_IIR,-12),'YYYY-MM'
- Mark as New
- Bookmark
- Subscribe
- Mute
- Subscribe to RSS Feed
- Permalink
- Report Inappropriate Content
Then, This should work
=Num(Sum({<Region={'Global'},DateMonth ={">=$(=Date(AddMonths(vMaxDate_IIR,-12),'YYYY-MM')) <=$(vMaxDate_IIR)"}>} YTD), '##.##')
- Mark as New
- Bookmark
- Subscribe
- Mute
- Subscribe to RSS Feed
- Permalink
- Report Inappropriate Content
Why i have not included = because i need 12 months period, if i include = it will show 13 months data
- Mark as New
- Bookmark
- Subscribe
- Mute
- Subscribe to RSS Feed
- Permalink
- Report Inappropriate Content
ok, if you add max here then?
{">$(=max(Date(AddMonths(vMaxDate_IIR,-12),'YYYY-MM')))
- Mark as New
- Bookmark
- Subscribe
- Mute
- Subscribe to RSS Feed
- Permalink
- Report Inappropriate Content
Date(AddMonths(vMaxDate_IIR,-12),'YYYY-MM')) this will gives you 2016-10, but in Your case you have use just > in Your setanalysis, which is 2016-11. So Your Expression says, show bigger values than 2016-10 and that is 2016-11
- Mark as New
- Bookmark
- Subscribe
- Mute
- Subscribe to RSS Feed
- Permalink
- Report Inappropriate Content
oh, I see your problem, you think that 2016-10 to 2017-10 is 12 month, its not, its 13.
You have to decide what is rolling 12, if you want to include both end period. 12 month back from 2017-10 is 2016-11 as you show in your pic, just count the month.
- Mark as New
- Bookmark
- Subscribe
- Mute
- Subscribe to RSS Feed
- Permalink
- Report Inappropriate Content
My max date is 2017-10
If i use addmonths(vMaxDate_IIR,-12) ...it gives 2016-10
NOw in expression i have given >addmonths(vMaxDate_IIR,-12) ....which gives 2016-11
and <=MaxDate means 2017-10
so from 2016-11 to 2017-10....which is 12 months period
The problem i am facing is graph is not giving 12 months rolling value, but it is showing according tomonth value
- « Previous Replies
-
- 1
- 2
- Next Replies »