Unlock a world of possibilities! Login now and discover the exclusive benefits awaiting you.
- Qlik Community
- :
- All Forums
- :
- QlikView App Dev
- :
- Re: Rollig 12 Months in Bar chart
- Subscribe to RSS Feed
- Mark Topic as New
- Mark Topic as Read
- Float this Topic for Current User
- Bookmark
- Subscribe
- Mute
- Printer Friendly Page
- Mark as New
- Bookmark
- Subscribe
- Mute
- Subscribe to RSS Feed
- Permalink
- Report Inappropriate Content
Rollig 12 Months in Bar chart
Hi All,
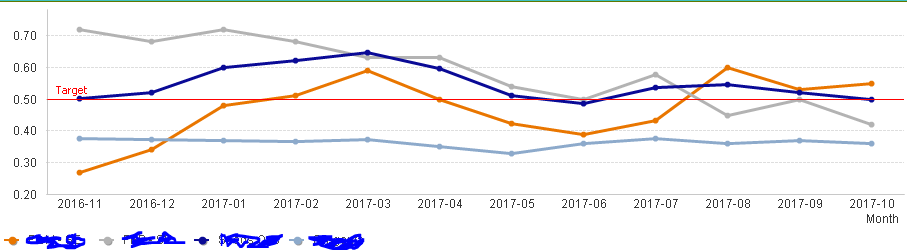
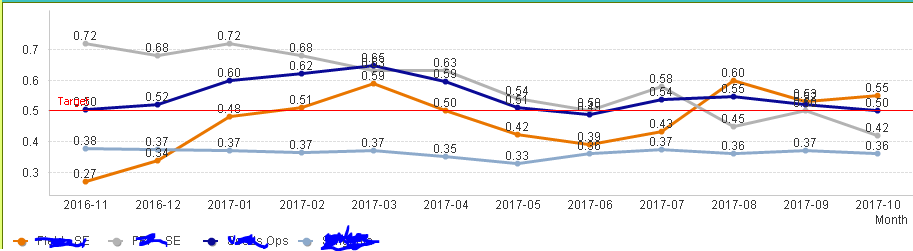
I have created a chart for Rolling 12 months on month and function as dimension below
Expression is
=Num(Sum({<Region={'Global'},DateMonth ={">$(=Date(AddMonths(vMaxDate_IIR,-12),'YYYY-MM')) <=$(vMaxDate_IIR)"}>} YTD), '##.##')
But it is showing Respective Month Value not the rolling 12 months for every line
Checked Dates and giving correct value ---- Date(AddMonths(vMaxDate_IIR,-12),'YYYY-MM') and to ---vMaxDate_IIR
When i tried expression with text box and giving selections accordingly it is giving rolling 12 months value
Please suggest me on this.
Thanks in advance
- « Previous Replies
-
- 1
- 2
- Next Replies »
- Mark as New
- Bookmark
- Subscribe
- Mute
- Subscribe to RSS Feed
- Permalink
- Report Inappropriate Content
I'm not sure what you try to achive, rolling 12 month is exactly what you are showing in Your graph.
Or is it some kind of dynamic graph that you want according to what selections you made?
- Mark as New
- Bookmark
- Subscribe
- Mute
- Subscribe to RSS Feed
- Permalink
- Report Inappropriate Content
The value showing are values on particular single month
But i need Rollong 12 months value per each month
For Eg:
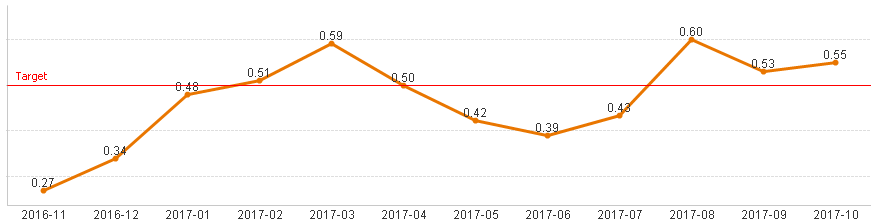
If you see the orange line for 2017-10 the value it showing is 0.55
But i need to show the sum of the months which is 5.62(This is Rolling 12 months value)
same way i need to show for all months.
For 2016-11....the valuse should be Sum of 12 months from this month(2015-12 to 2016-11)
For 2016-12...................(2016-01 to 2016-12)
;
;
;
2017-10 ................(2016-11 to 2017-10)
- Mark as New
- Bookmark
- Subscribe
- Mute
- Subscribe to RSS Feed
- Permalink
- Report Inappropriate Content
ok so you want a accumulated value for 12 month back in Your rolling 12 month graph.
That will twist Your Expression a lot I'll think.
- Mark as New
- Bookmark
- Subscribe
- Mute
- Subscribe to RSS Feed
- Permalink
- Report Inappropriate Content
check if this Expression helps you, some small changes maybe needed.
Num(Sum({<Region={'Global'},DateMonth ={">$(=Date(AddMonths(vMaxDate_IIR,-12),'YYYY-MM')) <=$(vMaxDate_IIR)"}>}
aggr(RangeSum(above(sum(YTD),0,12)),DateMonth)), '##.##')
- Mark as New
- Bookmark
- Subscribe
- Mute
- Subscribe to RSS Feed
- Permalink
- Report Inappropriate Content
Tried with your expression, but giving only wrong values, that too only one line instead of 4.
But when i do selction for particular a function, it is giving correct value, but i clear it showing big values.
- Mark as New
- Bookmark
- Subscribe
- Mute
- Subscribe to RSS Feed
- Permalink
- Report Inappropriate Content
If you have 4 Expressions, then you need to change all of them in the same way.
If you only have one Expression and two Dimension, then add the second Dimension in the aggr function like this.
Num(Sum({<Region={'Global'},DateMonth ={">$(=Date(AddMonths(vMaxDate_IIR,-12),'YYYY-MM')) <=$(vMaxDate_IIR)"}>}
aggr(RangeSum(above(sum(YTD),0,12)),DateMonth,dimension2)), '##.##')
- Mark as New
- Bookmark
- Subscribe
- Mute
- Subscribe to RSS Feed
- Permalink
- Report Inappropriate Content
Thanks Johansson
Solved but for getting correct values i have changed the expression to
=Num(Aggr(Rangesum(Above(Sum({<Region={'Global'}>}YTD),0,12)),Function,DateMonth),'##.##')
- « Previous Replies
-
- 1
- 2
- Next Replies »