Unlock a world of possibilities! Login now and discover the exclusive benefits awaiting you.
- Qlik Community
- :
- All Forums
- :
- QlikView App Dev
- :
- Re: Rolling 12 months calc, not showing correct fi...
- Subscribe to RSS Feed
- Mark Topic as New
- Mark Topic as Read
- Float this Topic for Current User
- Bookmark
- Subscribe
- Mute
- Printer Friendly Page
- Mark as New
- Bookmark
- Subscribe
- Mute
- Subscribe to RSS Feed
- Permalink
- Report Inappropriate Content
Rolling 12 months calc, not showing correct figures
Hi all, hope you're having a good day.
I am hoping, you can solve my head scratching query, around a rolling 12 month calculation not working.
As per my attached qvd, there are two tables.
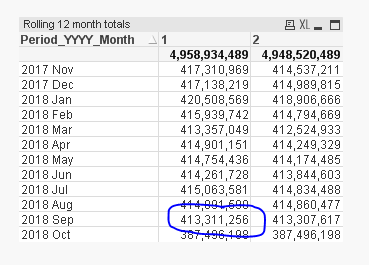
First one showing, 12 month totals per month.
The second, showing the individual months total
So if you added up 2018 Oct to 2017 Nov = 387,496,198, which you'll see from the first table is 100% correct.
If you do the next one being, 2018 Sep to 2017 Oct = 413,311,256 which then doesnt equal the first table of 413,307,617.
So i'm a little confused, why this is not showing the correct total for the 12 months total?!
Any help, would be greatly appreciated.
- « Previous Replies
-
- 1
- 2
- Next Replies »
- Mark as New
- Bookmark
- Subscribe
- Mute
- Subscribe to RSS Feed
- Permalink
- Report Inappropriate Content
Just some observations:
- In Sunny's table document, you can see that 2017 Oct is the first month for which the value in [1] is different from the value in [2], which is why for 2018 Oct your total value was fine
- When you select 2018 Sep in your original file, the total value IS 413,311,256
- When you select 2017 Oct - 2018 Sep in Sunny's document, the values for each month the selected months change and become the same as in your image (and the total value adds up to the right amount)
- When you add 1 (ignore selections) to every set analysis in your expression, the values (I think) are correct (or at least, the same as in your image) I thought this worked, but I was wrong
Don't know if any of this helps, just thought I'd put it out there.
- Mark as New
- Bookmark
- Subscribe
- Mute
- Subscribe to RSS Feed
- Permalink
- Report Inappropriate Content
I get this and you can get this result if you use this expression...
=Sum({<[Period_Sort] = {">=$(=max([Period_Sort])-11)<=$(=max([Period_Sort]))"}, Month, Year_YYYY, Quarter_QQ, Period_YYYY_Month>}Aggr(RangeSum(Above(Sum({<[Period_Sort], Month, Year_YYYY, Quarter_QQ, Period_YYYY_Month>} Revenue), 0, 12)), ([Period_Sort],(NUMERIC, ASCENDING))))
Right?
- Mark as New
- Bookmark
- Subscribe
- Mute
- Subscribe to RSS Feed
- Permalink
- Report Inappropriate Content
Hi Sunny, many thanks for your reply
Yes the penny has dropped and I get what you mean with the Client_Name, within the calculation.
Basically the client has to appear in every 12 month total, for the numbers to agree.
So in summary, It only takes the client_Name within the first 12 months as it's list for the rest.
Will have to think of another idea, to include all clients with those variables.
any suggestions welcome? 
- Mark as New
- Bookmark
- Subscribe
- Mute
- Subscribe to RSS Feed
- Permalink
- Report Inappropriate Content
I guess I am confused as to what you are looking to do. Can we take a step back (and assume me to be completely dumb for a minute) and explain what exactly are you trying to do?
- Mark as New
- Bookmark
- Subscribe
- Mute
- Subscribe to RSS Feed
- Permalink
- Report Inappropriate Content
you are far from dumb Sunny my friend
Right so the calculation you stated works; in that, you get each of those 12 categories showing you the total for that current month plus the previous 11 (so basically a rolling 12 month total for each category).
However, this falls over when you put the client_name within the calculation (as we've seen, gives different totals due to not having all clients)
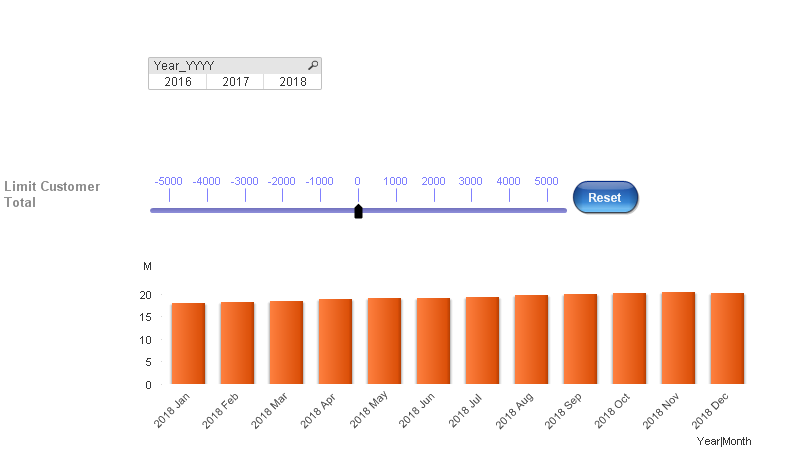
I require this as per my attached qvw, where i have the min and max variables within a slider (so the user can remove client totals of their choice)
So in summary, I require 12 categories showing 12 month totals, together with the min and max variables at client level.
Simple huh haha
Thanks for your any advice.
- Mark as New
- Bookmark
- Subscribe
- Mute
- Subscribe to RSS Feed
- Permalink
- Report Inappropriate Content
you are far from dumb Sunny my friend
Right so the calculation you stated works; in that, you get each of those 12 categories showing you the total for that current month plus the previous 11 (so basically a rolling 12 month total for each category).
However, this falls over when you put the client_name within the calculation (as we've seen, gives different totals due to not having all clients)
I require this as per my attached qvw, where i have the min and max variables within a slider (so the user can remove client totals of their choice)
So in summary, I require 12 categories showing 12 month totals, together with the min and max variables at client level.
Simple huh haha
Thanks for your any advice.
- Mark as New
- Bookmark
- Subscribe
- Mute
- Subscribe to RSS Feed
- Permalink
- Report Inappropriate Content
Can you check if this is what you want?
=RangeSum(Above(Sum({<[Period_Sort], Month, Year_YYYY, Quarter_QQ, Period_YYYY_Month,
Customer={"=round(Sum({<[Period_Sort], Month, Year_YYYY, Quarter_QQ, Period_YYYY_Month>}Revenue))<=$(vMinLimit)
or
round(Sum({<[Period_Sort], Month, Year_YYYY, Quarter_QQ, Period_YYYY_Month>} Revenue))>=$(vMaxLimit)"}>} Revenue), 0, 12))
* Avg({<[Period_Sort]={">=$(=max([Period_Sort])-11)<=$(=max([Period_Sort]))"},Month= ,Year_YYYY= ,Quarter_QQ= , Period_YYYY_Month=>} 1)
If this is right, I might know what is going on and can explain it better. But before I do, it would be nice to know if this is right or not
- Mark as New
- Bookmark
- Subscribe
- Mute
- Subscribe to RSS Feed
- Permalink
- Report Inappropriate Content
fantastic Sunny, this works and is exactly what i require.
the correct figures for each category of 12 months, working with the two variables.
I am now very intrigued as to know what is going on, so explain away
Many thanks
- Mark as New
- Bookmark
- Subscribe
- Mute
- Subscribe to RSS Feed
- Permalink
- Report Inappropriate Content
The problem was that your inner set analysis check against Client_Name also included set analysis to only look at >Max_Period - 11 <Max_Period. So, the limits were only checked for those revenues which fell within that date range. So, essentially, any customer which was in the limit but didn't have any sales within the date range was excluded. I removed that bit of the set analysis and boom you got what you needed.
Does that make sense?
- Mark as New
- Bookmark
- Subscribe
- Mute
- Subscribe to RSS Feed
- Permalink
- Report Inappropriate Content
Nice one Sunny, completely makes sense
thank you for explaining
One more thing, I would like to understand is;
how does the below line of putting average at the beginning and 1 at the end, limit the categories to just 12 in the table?
* Avg({<[Period_Sort]={">=$(=max([Period_Sort])-11)<=$(=max([Period_Sort]))"},Month= ,Year_YYYY= ,Quarter_QQ= , Period_YYYY_Month=>} 1)
- « Previous Replies
-
- 1
- 2
- Next Replies »