Unlock a world of possibilities! Login now and discover the exclusive benefits awaiting you.
- Qlik Community
- :
- All Forums
- :
- QlikView App Dev
- :
- Rolling 12 months
- Subscribe to RSS Feed
- Mark Topic as New
- Mark Topic as Read
- Float this Topic for Current User
- Bookmark
- Subscribe
- Mute
- Printer Friendly Page
- Mark as New
- Bookmark
- Subscribe
- Mute
- Subscribe to RSS Feed
- Permalink
- Report Inappropriate Content
Rolling 12 months
Hi,
I am relatively new in Qlikview. Would appreciate your help in solving my problems:
1) I want to show sales for rolling 12 months in both Chart and Table? So standing in Sep'13, I want chart/table dimension to be Sep'12 to Sep'13
2)Also I want to compare YoY growth of my sales for last 3 months? Sep'13 vs. Sep'12 growth, Aug'13 vs. Aug'12 and July'13 vs. July'12
The example of my dataset:
LOAD*INLINE
[
MONTH,SALES
Jan'12, 90
Jan'13, 100
Feb'12, 120
Feb'13, 110
Mar'12, 80
Mar'13, 90
Apr'12, 60
Apr'13, 70
May'12, 70
May'13, 60
Jun'12, 70
Jun'13, 50
Jul'12, 80
Jul'13, 90
Aug'12, 120
Aug'13, 110
Sep'12, 110
Sep'13, 100
Oct'12, 100
Nov'12, 100
Dec'12, 70
]
;
- Tags:
- new_to_qlikview
- Mark as New
- Bookmark
- Subscribe
- Mute
- Subscribe to RSS Feed
- Permalink
- Report Inappropriate Content
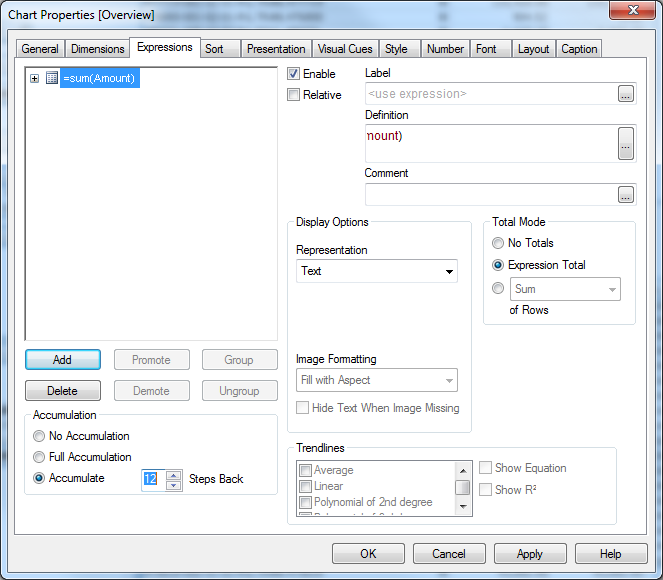
Hi Simky
The most straight forward way of producing a rolling aggregate is to use the 'Accumulation' feature found under the Expressions tab (bottom left) of your chart. AS can be seen in the picture below;
For comparing periods in one year against a period in another year (be that one month or several) the Set Analysis feature would prove most useful. There's plenty of useful information under help in the application, otherwise you would use a formula like the one listed below;
sum ( {< Year = {$(#=Only(Year)-1)}>} } >} Amount)
or you could set up an variable to derive the previous year (and previous year -1 etc.) and the formula would read;
sum ( {< Year = {$(#vLastYear)}>} >} Amount)
where vLastYear is the variable.
I hope this helps.
Regards
Steve
- Mark as New
- Bookmark
- Subscribe
- Mute
- Subscribe to RSS Feed
- Permalink
- Report Inappropriate Content
There are many ways to accomplish that kind of requirement, but this post explains the most commonly used:
Calculating rolling n-period totals, averages or other aggregations
- Mark as New
- Bookmark
- Subscribe
- Mute
- Subscribe to RSS Feed
- Permalink
- Report Inappropriate Content
Hi,
Please refer following link to achieve the Rolling 12 months in script.
http://community.qlik.com/thread/90905
Regards,