Unlock a world of possibilities! Login now and discover the exclusive benefits awaiting you.
- Qlik Community
- :
- All Forums
- :
- QlikView App Dev
- :
- Re: Rolling-n: Why does sum(aggr(rangeavg(above(to...
- Subscribe to RSS Feed
- Mark Topic as New
- Mark Topic as Read
- Float this Topic for Current User
- Bookmark
- Subscribe
- Mute
- Printer Friendly Page
- Mark as New
- Bookmark
- Subscribe
- Mute
- Subscribe to RSS Feed
- Permalink
- Report Inappropriate Content
Rolling-n: Why does sum(aggr(rangeavg(above(total sum..())))) not work with more than one dimension?
Hi all,
I need to calculate a variable rolling avg of sum() per months for a second dimension.
So I am using as formula
=sum(aggr(rangeavg(above(sum({$<Date=>}Value),0,3)),Date))
(here the variable is substituted by the fixed value of 3).
It works well in a straight table with [Date] as dimension but if fails in a straight table with another dimension.
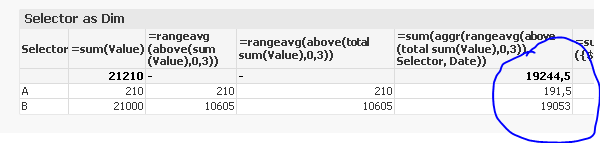
Please have a look at the example. I resorted the table as ordered by Date asc first,then by the second dimension.
My questions are:
A) Why does it show the total in one row of the table "Selector as Dim" and the other row being empty?
B) How do I properly calculate the sum of rolling averages for each value of the dimension [Selector]?
Thanks for any help,
Andreas
Accepted Solutions
- Mark as New
- Bookmark
- Subscribe
- Mute
- Subscribe to RSS Feed
- Permalink
- Report Inappropriate Content
May be you need this?
=Sum(Aggr(RangeAvg(Above(TOTAL Sum(Value),0,3)), Selector, Date))
- Mark as New
- Bookmark
- Subscribe
- Mute
- Subscribe to RSS Feed
- Permalink
- Report Inappropriate Content
May be you need this?
=Sum(Aggr(RangeAvg(Above(TOTAL Sum(Value),0,3)), Selector, Date))
- Mark as New
- Bookmark
- Subscribe
- Mute
- Subscribe to RSS Feed
- Permalink
- Report Inappropriate Content
You need to aggregate your expression on the dimension used
so for the below change Aggregation from [Date] dimension to [Selector]
=sum(aggr(rangeavg(above(sum({$<Date=>}Value),0,3)),Date))
to
=sum(aggr(rangeavg(above(sum({$<Date=>}Value),0,3)),Selector))
The expression total rownumber is 0; so rangeavg for rows above 0 is nothing! that is why it returns null. Change this to sum of rows.
If a post helps to resolve your issue, please accept it as a Solution.
- Mark as New
- Bookmark
- Subscribe
- Mute
- Subscribe to RSS Feed
- Permalink
- Report Inappropriate Content
Thank you Sunny,
I recall now that some time ago I posted a similar problem. Seems like I need a bigger hammer to get this into my head .
.
One question about the TOTAL: What is its result in a aggr()? I understand that it disregards the dimension in a chart.
=Sum(Aggr(RangeAvg(Above(TOTAL Sum(Value),0,3)), Selector, Date))
What dimension would be disregarded in this solution and what would be its purpose?
The correct result for B is in my understanding 19150 and not 19053.
I get 19150 as a result when I omit the TOTAL.
Andreas
- Mark as New
- Bookmark
- Subscribe
- Mute
- Subscribe to RSS Feed
- Permalink
- Report Inappropriate Content
Well Total within Above function makes it a continuous RangeAvg when you have multiple dimensions (Selector and Date) where as without TOTAL it would be RangeAvg for your second dimension which resets for change in your first dimension (RangeAvg for Date which resets for each of the selector). Above cannot take field name after TOTAL.
Does that make sense?