Unlock a world of possibilities! Login now and discover the exclusive benefits awaiting you.
- Qlik Community
- :
- All Forums
- :
- QlikView App Dev
- :
- Round 100% to 0 decimals, others to 1 decimal in g...
- Subscribe to RSS Feed
- Mark Topic as New
- Mark Topic as Read
- Float this Topic for Current User
- Bookmark
- Subscribe
- Mute
- Printer Friendly Page
- Mark as New
- Bookmark
- Subscribe
- Mute
- Subscribe to RSS Feed
- Permalink
- Report Inappropriate Content
Round 100% to 0 decimals, others to 1 decimal in graph and on axis?
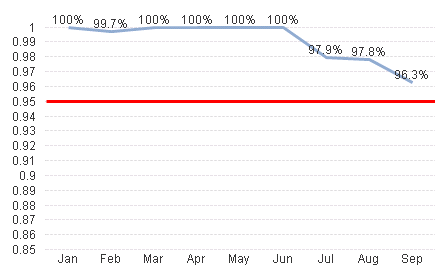
Hi, I had a request to make a line graph show 100% instead of 100.0% on the data points to give it a cleaner look. The other values remain rounded to the nearest 0.1% so we can see ups and downs in a fairly small range.
The graph has Month for the Dimension on the horizontal X-axis and Percents on the Y-axis. The expression is:
if(Num(avg([Less than 24]/Total), '###.#%')='100.0%', Num(avg([Less than 24]/Total),'###%'), Num(avg([Less than 24]/Total),'###.#%'))
[Less than 24] is field containing the number of responses provided in under 24 hours, and Total is a field containing the total number of inquiries. The values in these two fields are simple numbers like 12, 1, 438, etc.
On the Axes tab, we have the Scale set with Static Max 100%, Static Min 85%, and Step 1%.
The values on the data points on the line show 100%, 97.2%, 98.0% etcetera, but the values on the Y-axis show 0.85...0.89, 0.9, 0.91...0.99,1
How do we get the Y-axis to show numbers like 85%...89%,90%,91%...99%,100%? (Without reverting the 100% back to 100.0% on the data points in the line chart.) Here's an image of the graph in question with some test data:
Accepted Solutions
- Mark as New
- Bookmark
- Subscribe
- Mute
- Subscribe to RSS Feed
- Permalink
- Report Inappropriate Content
Funny, I Googled and found this in QlikCommunity: Convert Y-Axis to Percentage
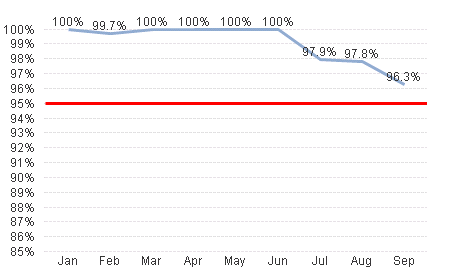
I had tried converting to percentage already, but messed with the number formatting this time and got the Y-Axis to show what I wanted. Leaving my aforementioned dimension and expression exactly as they were in the previous post. I only made the following changes:
On the Number tab, check the Number bubble, then change Format Pattern to ###%, then check the Show in Percent (%) box.
This is the result:
- Mark as New
- Bookmark
- Subscribe
- Mute
- Subscribe to RSS Feed
- Permalink
- Report Inappropriate Content
Funny, I Googled and found this in QlikCommunity: Convert Y-Axis to Percentage
I had tried converting to percentage already, but messed with the number formatting this time and got the Y-Axis to show what I wanted. Leaving my aforementioned dimension and expression exactly as they were in the previous post. I only made the following changes:
On the Number tab, check the Number bubble, then change Format Pattern to ###%, then check the Show in Percent (%) box.
This is the result: