Unlock a world of possibilities! Login now and discover the exclusive benefits awaiting you.
- Qlik Community
- :
- All Forums
- :
- QlikView App Dev
- :
- Running Total/Average
- Subscribe to RSS Feed
- Mark Topic as New
- Mark Topic as Read
- Float this Topic for Current User
- Bookmark
- Subscribe
- Mute
- Printer Friendly Page
- Mark as New
- Bookmark
- Subscribe
- Mute
- Subscribe to RSS Feed
- Permalink
- Report Inappropriate Content
Running Total/Average
Hi,
How I may get the above results in a given series of data array which might look something like below!
Thanks
Neville
| Item | 2012 | 2013 | 2014 | 2015 | 2016 | 2017 |
| revenue | 250,000 | 352,000 | 325,000 | 325,000 | 450,000 | 500,000 |
| Expenses | 100,000 | 75,000 | 85,000 | 50,000 | 75,000 | 85,000 |
| Running Total | 250,000 | 602,000 | 927,000 | 1,252,000 | 1,702,000 | 2,202,000 |
| Running Average | 250,000 | 301,000 | 309,000 | 313,000 | 340,400 | 367,000 |
Accepted Solutions
- Mark as New
- Bookmark
- Subscribe
- Mute
- Subscribe to RSS Feed
- Permalink
- Report Inappropriate Content
HI!
Great! Results were produced instantly. Dear Sunny & the rest of the guys, please accept my good wishes!
- Mark as New
- Bookmark
- Subscribe
- Mute
- Subscribe to RSS Feed
- Permalink
- Report Inappropriate Content
Hi, in your pivot chart, try with the following expression :
after(rangesum(Before(Sum(Revenue),1,ColumnNo())))
- Mark as New
- Bookmark
- Subscribe
- Mute
- Subscribe to RSS Feed
- Permalink
- Report Inappropriate Content
For running total, a better way with :
rangesum(First(Sum(Revenue),1,ColumnNo()))
- Mark as New
- Bookmark
- Subscribe
- Mute
- Subscribe to RSS Feed
- Permalink
- Report Inappropriate Content
Hi!
Dear,
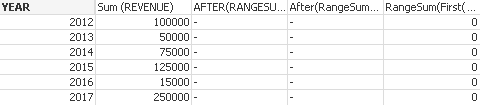
See where I have gone wrong!. It looks like results are not produced!
RangeSum(First(Sum(REVENUE),1,ColumnNo()))
After(RangeSum(Before(Sum(REVENUE),1,ColumnNo())))
- Mark as New
- Bookmark
- Subscribe
- Mute
- Subscribe to RSS Feed
- Permalink
- Report Inappropriate Content
If Year is going down instead of going across, try this
Running Total
RangeSum(Above(Sum(REVENUE), 0, RowNo()))
Running Average
RangeAvg(Above(Sum(REVENUE), 0, RowNo()))
- Mark as New
- Bookmark
- Subscribe
- Mute
- Subscribe to RSS Feed
- Permalink
- Report Inappropriate Content
Hi,
Please find calculations for Running Total and Average
Total
=RangeSum(Above(TOTAL RangeSum(Revenue), 0, RowNo(TOTAL)))
Average
=RangeAvg(Above(TOTAL RangeSum(Revenue), 0, RowNo(TOTAL)))
As Sunny mentioned about data and above was using his other response
- Mark as New
- Bookmark
- Subscribe
- Mute
- Subscribe to RSS Feed
- Permalink
- Report Inappropriate Content
In your sample for me it was a pivot chart with Item as dimension and Year as column. If it's a straight table with only year as dimension, as said by Sunny, use above() or top() with
rangesum(Top(Sum(Revenue),1,RowNo()))
- Mark as New
- Bookmark
- Subscribe
- Mute
- Subscribe to RSS Feed
- Permalink
- Report Inappropriate Content
HI!
Great! Results were produced instantly. Dear Sunny & the rest of the guys, please accept my good wishes!