Unlock a world of possibilities! Login now and discover the exclusive benefits awaiting you.
- Qlik Community
- :
- All Forums
- :
- QlikView App Dev
- :
- Sales on Year minus Sales on Previous Year
- Subscribe to RSS Feed
- Mark Topic as New
- Mark Topic as Read
- Float this Topic for Current User
- Bookmark
- Subscribe
- Mute
- Printer Friendly Page
- Mark as New
- Bookmark
- Subscribe
- Mute
- Subscribe to RSS Feed
- Permalink
- Report Inappropriate Content
Sales on Year minus Sales on Previous Year
Hello everyone 
I've been looking for an answer for quite a while, without success.
Here's the problem:
I need to create a chart where there'll be something like this
Year Value Growth
2000 10 N/A
2001 40 30
2002 20 -20
2003 40 20
Don't pay to much attention on the values, it's just an example.
I actually need to compare values of a same Element on two different dates
I'd write it like this: sum(SALES[YEAR]) - sum(SALES[YEAR-1])
but apparently, it doesn't work that way.
I also tried by creating variables like vYear = YEAR and vPrevYear = YEAR - 1
But nothing works 😕
Please help !
- Mark as New
- Bookmark
- Subscribe
- Mute
- Subscribe to RSS Feed
- Permalink
- Report Inappropriate Content
You can try sum(Value) - sum(above(Value).
Or read this document: Calculating rolling n-period totals, averages or other aggregations
talk is cheap, supply exceeds demand
- Mark as New
- Bookmark
- Subscribe
- Mute
- Subscribe to RSS Feed
- Permalink
- Report Inappropriate Content
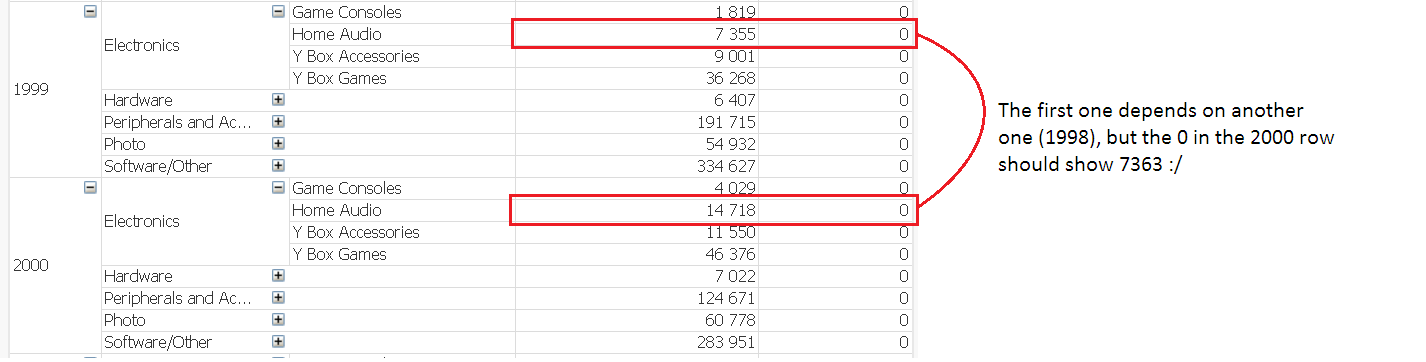
Thanks, it worked quite well for one of them, also used the below() for another one, but I still have an issue for where they're not right above/underneath each other.
In the picture, the last blocks (the ones with 0) need to show the growth for each type of object year to year.
So the above works well when nothing is expanded, as years appear right above each others, but when I expand the objects fields, it's not working anymore 😕
Thanks again 
- Mark as New
- Bookmark
- Subscribe
- Mute
- Subscribe to RSS Feed
- Permalink
- Report Inappropriate Content
Hi Matthieu,
Also please don't forget about set analysis mechanism which is far stronger then inter-record functions.
With this you can state:
Sum({<Year={2000}>} Value) = Sum({<Year={2001}>} Value)
OR
Define variables vCurrYear and vPrevYear and then use them:
Sum({<Year={$(vCurrYear)}>} Value) = Sum({<Year={$(vPrevYear)}>} Value)
OR
It's event possible to fold all set analysis expression into variable - vCurrYear = Year={$(vCurrYearNum)}
(not sure the syntaxis is correct everywhere, but the idea is clear I hope)
Best regards,
Maxim
- Mark as New
- Bookmark
- Subscribe
- Mute
- Subscribe to RSS Feed
- Permalink
- Report Inappropriate Content
The inter-record functions like above, below, before etc.. by default don't cross dimension borders. By adding the TOTAL qualifier they will cross dimension borders. Unfortunately it's a all or nothing, either none or ignore all dimension borders. In case of your pivot table you could try pivoting your year dimension to horizontal layout by dragging its header to the right above the expressions. There'll be only the year dimension horizontally so sum(value) - before(sum(value)) should work.
If that's not a workable solution you can try the AsOf solution described in the document Calculating rolling n-period totals, averages or other aggregations
talk is cheap, supply exceeds demand
- Mark as New
- Bookmark
- Subscribe
- Mute
- Subscribe to RSS Feed
- Permalink
- Report Inappropriate Content
Hi,
PFA the attached application.
Thanks and Regards,
Ankita
- Mark as New
- Bookmark
- Subscribe
- Mute
- Subscribe to RSS Feed
- Permalink
- Report Inappropriate Content
Thanks for all the answers,
I managed to get to something like this
Sum({<CALENDAR_YEAR={$(vYear)}>} AMOUNT_SOLD/PROD_LIST_PRICE) -
Sum({<CALENDAR_YEAR={$(vPreviousYear)}>} AMOUNT_SOLD/PROD_LIST_PRICE)
(with vYear = CALENDAR_YEAR and vPreviousYear = CALENDAR_YEAR-1)
But it doesn't gets me what I need, here's what comes when I only select the 1999 year:
(Somme des quantitées vendues works with this expression: "sum(AMOUNT_SOLD/PROD_LIST_PRICE)")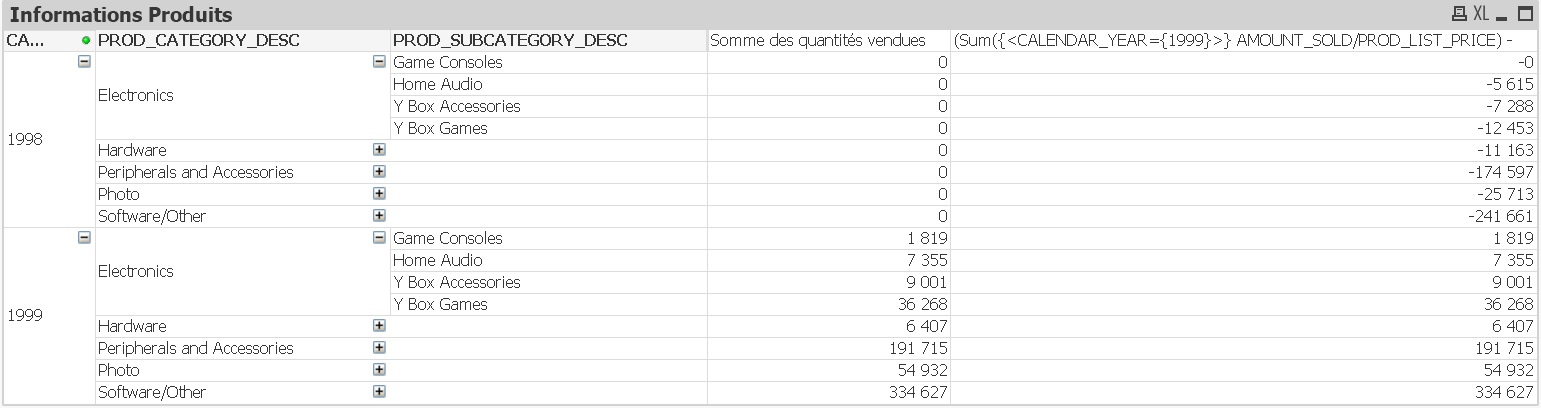
And here's what I got when nothing is selected: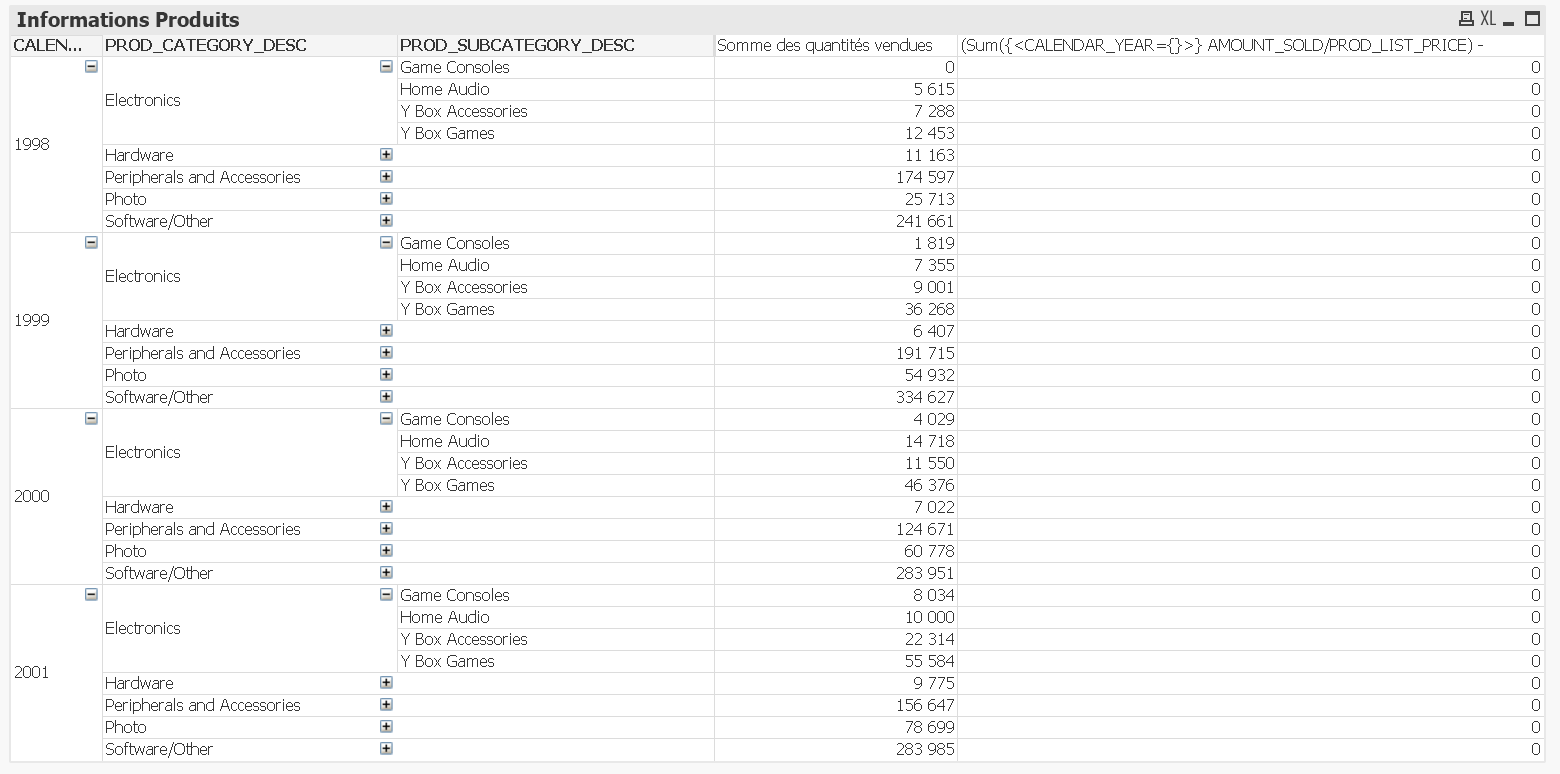
The idea is to just show 1999 rows, with in the first expression column those values (well, without the 0 for 1998 obviously) and in the second one getting sum(AMOUNT_SOLD/PROD_LIST_PRICE) for year in row MINUS sum(AMOUNT_SOLD/PROD_LIST_PRICE) for year before that
Thanks again for your help !