Unlock a world of possibilities! Login now and discover the exclusive benefits awaiting you.
- Qlik Community
- :
- All Forums
- :
- QlikView App Dev
- :
- Sample case with Pivot / Straight Table ?
- Subscribe to RSS Feed
- Mark Topic as New
- Mark Topic as Read
- Float this Topic for Current User
- Bookmark
- Subscribe
- Mute
- Printer Friendly Page
- Mark as New
- Bookmark
- Subscribe
- Mute
- Subscribe to RSS Feed
- Permalink
- Report Inappropriate Content
Sample case with Pivot / Straight Table ?
Dear Expert,
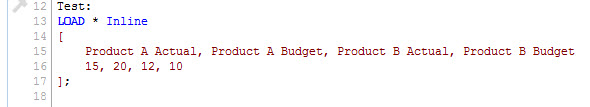
I have a data from load inline like this:
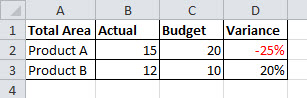
Can you provide me a solution, if i want to create a chart where my display expectation like this below?
Thank you in advance for your help...
- Mark as New
- Bookmark
- Subscribe
- Mute
- Subscribe to RSS Feed
- Permalink
- Report Inappropriate Content
You have to do some transformation to achieve this and need to create one flag for A and B
- Mark as New
- Bookmark
- Subscribe
- Mute
- Subscribe to RSS Feed
- Permalink
- Report Inappropriate Content
Hi Anil, thank you for the response.
Could you explain me solution about transformation that could solve my case above?
- Mark as New
- Bookmark
- Subscribe
- Mute
- Subscribe to RSS Feed
- Permalink
- Report Inappropriate Content
Hi,
Is your inline load data can change like this?
Data:
LOAD * INLINE [
Product Type, Actual, Budget
Product A, 15, 20
Product B, 12, 10
];
if so then without any transformation u can do it.
- Mark as New
- Bookmark
- Subscribe
- Mute
- Subscribe to RSS Feed
- Permalink
- Report Inappropriate Content
Hi Danny,
Devarasu R's solution looks good to me. I had worked out something that is not better but different and I'm posting it only to show that there are a couple of ways to go about this.
Data:
LOAD * Inline [
Product, Measure , Value
A, Actual, 15
A, Budget, 20
B, Actual, 12
B, Budget, 10
];
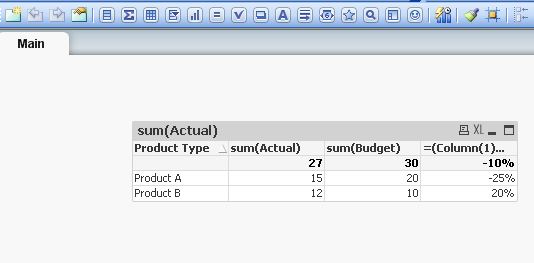
Then a straight table
| Product | Actual | Budget | Variance |
|---|---|---|---|
| A | 15 | 20 | -25% |
| B | 12 | 10 | 20% |
Actual = sum({$<Measure = {'Actual'}>}Value)
Budget = sum({$<Measure = {'Budget'}>}Value)
Variance = (Actual - Budget) / Budget formatted as % with text colour =if(Actual < Budget, LightRed())
Devarasu R's way is maybe a bit simpler.
cheers
Andrew
- Mark as New
- Bookmark
- Subscribe
- Mute
- Subscribe to RSS Feed
- Permalink
- Report Inappropriate Content
Hi, thank you both Devarasu and Andrew.
Actually, my Load Inline table has just a simple overview about my real data. Unfortunately, it can't be done to change the structure, because the data that I have is data that is processed from other data sources.
I'm interested about transformation described earlier. Without change my load inline structure, can we solve this case?
Or do you have any other solutions?
- Mark as New
- Bookmark
- Subscribe
- Mute
- Subscribe to RSS Feed
- Permalink
- Report Inappropriate Content
Hi Denny,
Try
Data:
CrossTable
LOAD
1 as Dummy,
*;
LOAD * INLINE [
Product A Actual, Product A Budget, Product B Actual, Product B Budget
15, 20, 12, 10
];
drop Field Dummy;
[Transformed Data]:
LOAD
SubField(Type,' ',2) as Product,
SubField(Type,' ',4) as Measure,
Value
Resident Data;
Drop Table Data;
There is a little bit of inconsistency in the original inline script. One space seperates the first and second substrings but two spaces seperate substrings two and three. That's why to get the Measure field I used SubField(Type,' ',4) .
Now we get a table like this in our data model:
| Product | Measure | Value |
|---|---|---|
| A | Actual | 15 |
| A | Budget | 20 |
| B | Actual | 12 |
| B | Budget | 10 |
Now the straight table I describes earlier will work.
Cheers
Andrew