Unlock a world of possibilities! Login now and discover the exclusive benefits awaiting you.
- Qlik Community
- :
- All Forums
- :
- QlikView App Dev
- :
- Re: Selection is not reflected in Chart
- Subscribe to RSS Feed
- Mark Topic as New
- Mark Topic as Read
- Float this Topic for Current User
- Bookmark
- Subscribe
- Mute
- Printer Friendly Page
- Mark as New
- Bookmark
- Subscribe
- Mute
- Subscribe to RSS Feed
- Permalink
- Report Inappropriate Content
Selection is not reflected in Chart
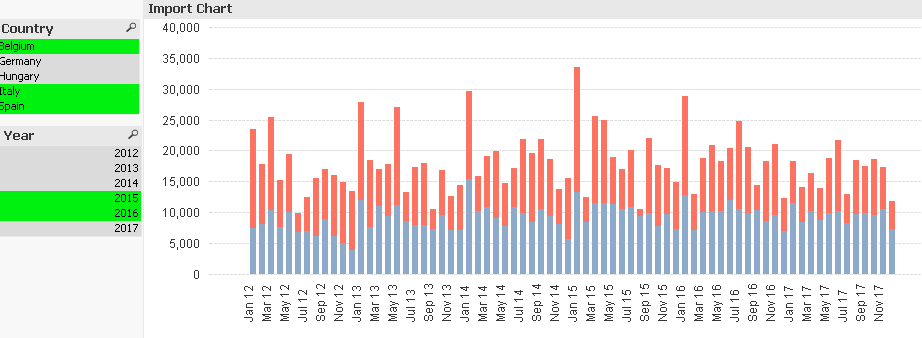
I have the below chart. When I select values in the list box, it is not reflected in the chart. The chart shows the whole set of data regardless of whatever I clicked on.
All the objects are assigned the same alternate state 1.
Does anyone knows what causes this problem? Thank you.
Accepted Solutions
- Mark as New
- Bookmark
- Subscribe
- Mute
- Subscribe to RSS Feed
- Permalink
- Report Inappropriate Content
Change the Alternate State from 1 to "Group 1" or something like that and it will work.
- Mark as New
- Bookmark
- Subscribe
- Mute
- Subscribe to RSS Feed
- Permalink
- Report Inappropriate Content
Change the Alternate State from 1 to "Group 1" or something like that and it will work.
- Mark as New
- Bookmark
- Subscribe
- Mute
- Subscribe to RSS Feed
- Permalink
- Report Inappropriate Content
Thanks Thirumala, it does. But how come changing the name will work?
Does naming after a number make the system confused?
- Mark as New
- Bookmark
- Subscribe
- Mute
- Subscribe to RSS Feed
- Permalink
- Report Inappropriate Content
In set analysis you can use "1" as part of the expression. My guess is when you are using "1" it is treating it as part of the expression but not treating it as the group name. Think "1" as the reserved word and try to use a name for the group. Hope this helps and please close the thread if you got the correct answer.