Unlock a world of possibilities! Login now and discover the exclusive benefits awaiting you.
- Qlik Community
- :
- All Forums
- :
- QlikView App Dev
- :
- Re: Selection on pivot table
- Subscribe to RSS Feed
- Mark Topic as New
- Mark Topic as Read
- Float this Topic for Current User
- Bookmark
- Subscribe
- Mute
- Printer Friendly Page
- Mark as New
- Bookmark
- Subscribe
- Mute
- Subscribe to RSS Feed
- Permalink
- Report Inappropriate Content
Selection on pivot table
Hi, I have a question about selection in pivot table.
here is my data:
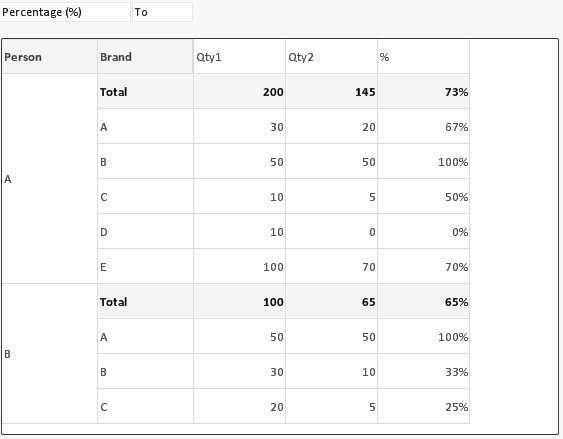
What i expect is, when i insert percentage, let's say 60 to 68. I want to check the quantity for each brand of one person. If at least one brand in the range of 60-68 i want to show all the data. We can see that brand A from person A has percentage 67%. because the requirement is at least one data, the condition return true and show all data of person A. here is the result I expect:
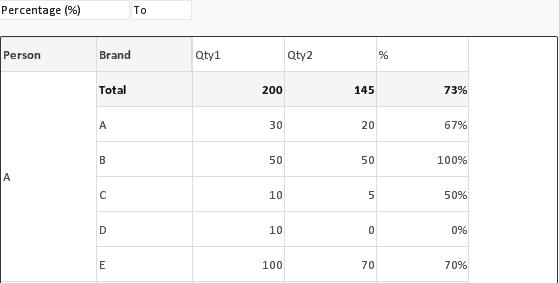
Person B not shown because none of each brand has fullfill the range between 60 to 68.
Really appreciate your help.
Thanks
- Tags:
- new_to_qlikview
- « Previous Replies
-
- 1
- 2
- Next Replies »
Accepted Solutions
- Mark as New
- Bookmark
- Subscribe
- Mute
- Subscribe to RSS Feed
- Permalink
- Report Inappropriate Content
May be like attached sample. Check the variables I created to grab the concept.
- Mark as New
- Bookmark
- Subscribe
- Mute
- Subscribe to RSS Feed
- Permalink
- Report Inappropriate Content
I also attach my sample qvw file here.
thanks
- Mark as New
- Bookmark
- Subscribe
- Mute
- Subscribe to RSS Feed
- Permalink
- Report Inappropriate Content
May be like attached sample. Check the variables I created to grab the concept.
- Mark as New
- Bookmark
- Subscribe
- Mute
- Subscribe to RSS Feed
- Permalink
- Report Inappropriate Content
Hi Tres,
thanks for your answer, you are a great problem solver. 
but i want to ask, how if i have more than two dimension, not only person or brand. let's say i have area dimension and staff name. which part i must change ?
thanks
- Mark as New
- Bookmark
- Subscribe
- Mute
- Subscribe to RSS Feed
- Permalink
- Report Inappropriate Content
If it is only about increasing dimension, you have to look into the variable -
vPersonEligibility
=Concat(Aggr(If(
$(vPercentFormula)*100>=60 and $(vPercentFormula)*100<=68,
Person
),Person, Brand, Area, StaffName)
)
Include the new dimensions under Aggr() scope, like shown above.
- Mark as New
- Bookmark
- Subscribe
- Mute
- Subscribe to RSS Feed
- Permalink
- Report Inappropriate Content
Hi Tres,
Do i need to add dimension combination in if() scope ? like this:
=Concat(Aggr(If(
$(vPercentFormula)*100>=60 and $(vPercentFormula)*100<=68,
Person&Area&StaffName
),Person, Brand, Area, StaffName)
)
because it will be some combination of the dimension
thanks
- Mark as New
- Bookmark
- Subscribe
- Mute
- Subscribe to RSS Feed
- Permalink
- Report Inappropriate Content
Try wihout that. If that doesn't give you what you need, try to share the sample with those additional dimension and expain the expected output.
- Mark as New
- Bookmark
- Subscribe
- Mute
- Subscribe to RSS Feed
- Permalink
- Report Inappropriate Content
Hi Tres,
I've apply your solution in large data. But unfortunately it runs very slow when loading (calculating) the data. Do you have any idea to improve the performance ?
thanks
- Mark as New
- Bookmark
- Subscribe
- Mute
- Subscribe to RSS Feed
- Permalink
- Report Inappropriate Content
Yes, use of aggr() might be causing the performance hit. To improve it you have to trade off; take it to the script if possible (because that would increase the reload time).
- Mark as New
- Bookmark
- Subscribe
- Mute
- Subscribe to RSS Feed
- Permalink
- Report Inappropriate Content
Hi Tres,
thanks for your response. Still don't get the idea. Can you explain about take it to the script ?
can you give me some example please ?
Really appreciate your help.
Thanks
- « Previous Replies
-
- 1
- 2
- Next Replies »