Unlock a world of possibilities! Login now and discover the exclusive benefits awaiting you.
- Qlik Community
- :
- All Forums
- :
- QlikView App Dev
- :
- Selectively filter graphs on a page
- Subscribe to RSS Feed
- Mark Topic as New
- Mark Topic as Read
- Float this Topic for Current User
- Bookmark
- Subscribe
- Mute
- Printer Friendly Page
- Mark as New
- Bookmark
- Subscribe
- Mute
- Subscribe to RSS Feed
- Permalink
- Report Inappropriate Content
Selectively filter graphs on a page
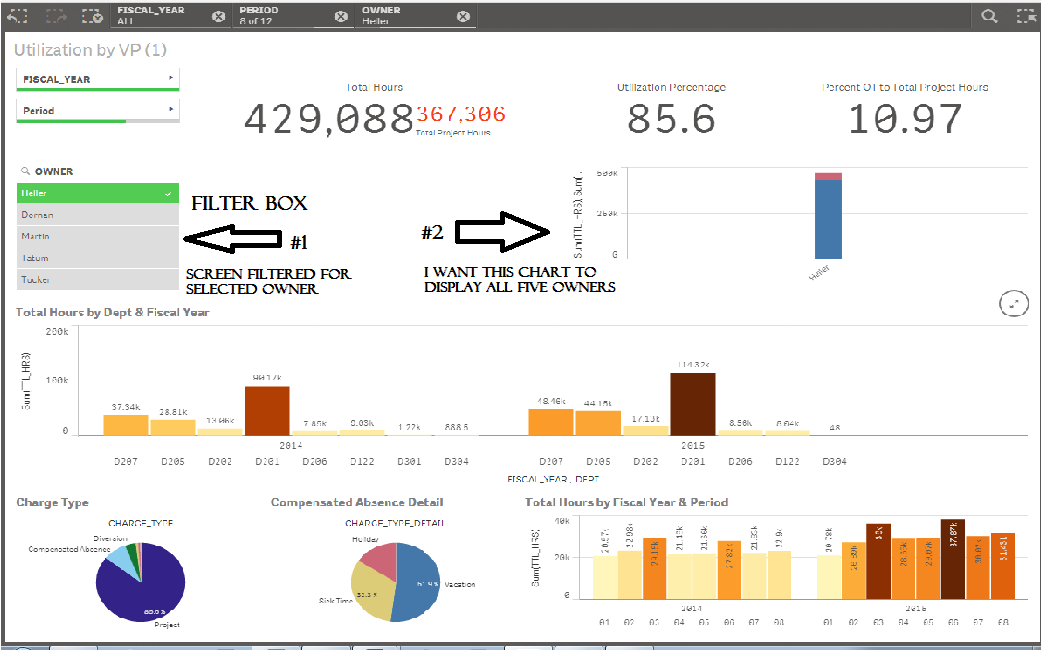
I'm new to Qlik and I've been tasked with something that is above my beginner status. Below is a screen that has been filtered by "Owner" (Filter Box #1). What I need is to have Chart #2 NOT filter but display totals for all the Owners. The intent is to create a "challenge" showing each Owner where they stand against the others.
Any help is appreciated.
- Tags:
- new_to_qlikview
Accepted Solutions
- Mark as New
- Bookmark
- Subscribe
- Mute
- Subscribe to RSS Feed
- Permalink
- Report Inappropriate Content
Try expression like:
Sum({<OWNER>} Amount)
It could be any other aggregation function in place of sum(). This is called Set Analysis, learn about it from help.
- Mark as New
- Bookmark
- Subscribe
- Mute
- Subscribe to RSS Feed
- Permalink
- Report Inappropriate Content
Try expression like:
Sum({<OWNER>} Amount)
It could be any other aggregation function in place of sum(). This is called Set Analysis, learn about it from help.
- Mark as New
- Bookmark
- Subscribe
- Mute
- Subscribe to RSS Feed
- Permalink
- Report Inappropriate Content
Thank you so much. That works perfectly.
- Mark as New
- Bookmark
- Subscribe
- Mute
- Subscribe to RSS Feed
- Permalink
- Report Inappropriate Content
I've used Set Analysis in other instances but I had a mental block on this one. Thanks again.