Unlock a world of possibilities! Login now and discover the exclusive benefits awaiting you.
- Qlik Community
- :
- All Forums
- :
- QlikView App Dev
- :
- Set Analysis Expression
- Subscribe to RSS Feed
- Mark Topic as New
- Mark Topic as Read
- Float this Topic for Current User
- Bookmark
- Subscribe
- Mute
- Printer Friendly Page
- Mark as New
- Bookmark
- Subscribe
- Mute
- Subscribe to RSS Feed
- Permalink
- Report Inappropriate Content
Set Analysis Expression
Hi,
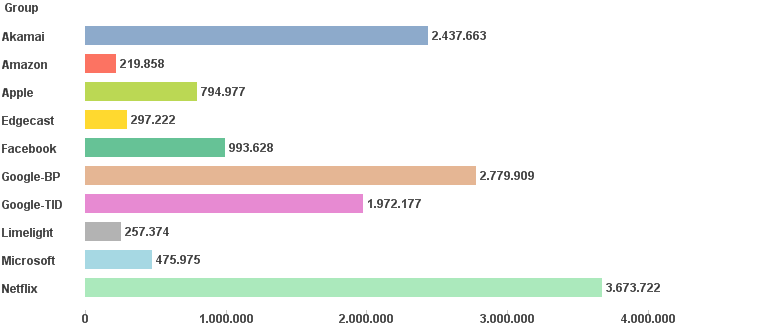
I want to plot a bar chart using Facebook, Google, etc. as my dimension and aggregate the data to Monthly level and show just one month of data.
The default month has to be one month after the current month, ie, July for this month (June). Otherwise if user makes a selection of any other Month and Year then show the data for that month.
I am looking for some help in writing the expression for this.
Accepted Solutions
- Mark as New
- Bookmark
- Subscribe
- Mute
- Subscribe to RSS Feed
- Permalink
- Report Inappropriate Content
- Mark as New
- Bookmark
- Subscribe
- Mute
- Subscribe to RSS Feed
- Permalink
- Report Inappropriate Content
Hi,
see Attachment.
Regards,
Antonio
- Mark as New
- Bookmark
- Subscribe
- Mute
- Subscribe to RSS Feed
- Permalink
- Report Inappropriate Content
Now the solution for your data set and visualization is as :
1. Using set analysis for Point of time and comparing the calculation over present month and previous month.
2. Aggregating the expression on Group level.
- Mark as New
- Bookmark
- Subscribe
- Mute
- Subscribe to RSS Feed
- Permalink
- Report Inappropriate Content
Hi,
Use below script and function inside a script,
CrossTable(Dimension, Data,4)
LOAD Week,
Month(Week) as Month,
Year(Week) as Year,
Date(MakeDate(Year(Week),Month(Week),01),'MM-YYYY') as MonthYear,
[Google-TID],
[Google-BP],
Akamai,
Netflix,
Apple,
Facebook,
Microsoft,
Amazon,
Edgecast,
Limelight
FROM
(ooxml, embedded labels, table is [Traffic (Mbps) W F]);
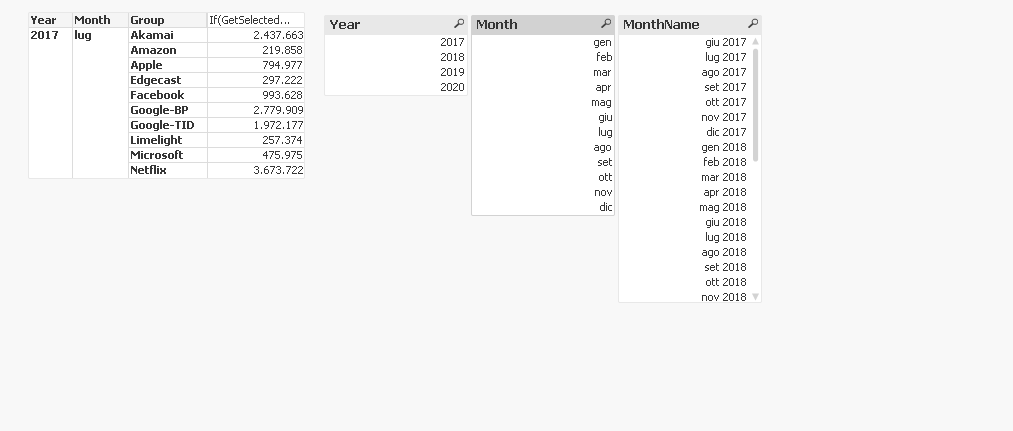
variable vMonth = =Date(if(GetPossibleCount(MonthYear)>1,AddMonths(Max(MonthYear),-1),Max(MonthYear)),'MM-YYYY')
Expression : sum({<MonthYear={'$(vMonth)'}>}Data)
- Mark as New
- Bookmark
- Subscribe
- Mute
- Subscribe to RSS Feed
- Permalink
- Report Inappropriate Content
Thanks Antonio!
Although your approach gives me some insight on how this could be achieved but I want a bar graph and on my dimensions I just want to have the "Groups" and not the Month and Year.
I am still trying to figure out how that could be done.
- Mark as New
- Bookmark
- Subscribe
- Mute
- Subscribe to RSS Feed
- Permalink
- Report Inappropriate Content
See Attachment