Unlock a world of possibilities! Login now and discover the exclusive benefits awaiting you.
- Qlik Community
- :
- All Forums
- :
- QlikView App Dev
- :
- Set Analysis expressios in Pivot from different su...
- Subscribe to RSS Feed
- Mark Topic as New
- Mark Topic as Read
- Float this Topic for Current User
- Bookmark
- Subscribe
- Mute
- Printer Friendly Page
- Mark as New
- Bookmark
- Subscribe
- Mute
- Subscribe to RSS Feed
- Permalink
- Report Inappropriate Content
Set Analysis expressios in Pivot from different sub-sets of data
Hi fellow QV-ers, pls help me out with this one!
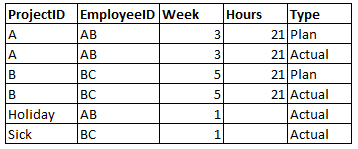
I have a dataset with plan and actual data concatenated in it. Sg. Like:
ProjectID,
EmployeeID,
Week,
Hours (hours an employee planned to spend or spent on a given project the given week),
Type (it is a Flag: 'Plan’, ’Actual’), ...
Besides normal customer projects and project ID-s, there is an extra project ID added to the set, lets call it 'holiday'. Days off-s, sick leaves are registred on it.
I made a pivot table with EmployeeID and Week as dimendions, and expressions for different types of hours:
sum( {<Type = {'Plan'}>} Hours)
sum( {<Type = {'Actual'}>} Hours)
I also added holiday/sick leave hours, so one could see why that week s/he had less project hours.
Here is my expr.:
sum( {$< ProjectID = {'holiday'}>} Hours)
Problem: If a project (other than ’holiday’) is selected in the Listbox the Pivot table will list all employees and their hours for both the selected project and also for holiday (because of the above set expression). As long as a 2nd selection is made on the employees belonging to the real project.
But this is not very user friendly. Can you suggest a way that when a project is selected in the listbox, the scope of employees in the Pivot table is also shrinked (excluding those employees that do not work on the project only have holiday hours) ?
I have tried lot of things from calulated dimensions to condiational expression nothing achives what I need. Thanks so much in advance! Cheers, Kavics
Accepted Solutions
- Mark as New
- Bookmark
- Subscribe
- Mute
- Subscribe to RSS Feed
- Permalink
- Report Inappropriate Content
Ok, you can try to change the EmployeeID dimension to a calculated dimension like:
=Aggr(Only(EmployeeID), EmployeeID)
so it only shows the employeeid included in current selections.
- Mark as New
- Bookmark
- Subscribe
- Mute
- Subscribe to RSS Feed
- Permalink
- Report Inappropriate Content
If i'm not mistaken.. so you fit all of that information in one flat table ?
I don't get it.. what are you trying to get ?
can you attach sample qvw.. so we can help you.
- Mark as New
- Bookmark
- Subscribe
- Mute
- Subscribe to RSS Feed
- Permalink
- Report Inappropriate Content
well, first thank you.
Yes I have a dataset like you discribed, except that holdiay and sick leave goes under the same project ID.
I attached a test qvw with the problem described inside.
The goal is: to see per employee, per week how many hours they spent on a project, how many hours was planned for them, and how many they spent on holiday.
But! When I select a Project ID, not only the employees who worked / planned on the project are listed but also others from the dataset who has holiday hours reported for the covered period. I would like the Pivot lines to show only the Employyes who belong to the selected project(s). Thanks!
- Mark as New
- Bookmark
- Subscribe
- Mute
- Subscribe to RSS Feed
- Permalink
- Report Inappropriate Content
Hi, Enikö,
I see you tried to use the conditional show on Leave expression, keeping that approach you can use this conditional expression:
IF(index(concat(ProjectID, ';'), 'holiday'), 1, 0)
Edit: contional expression can be simplified to: Index(Concat(ProjectID), 'holiday')
- Mark as New
- Bookmark
- Subscribe
- Mute
- Subscribe to RSS Feed
- Permalink
- Report Inappropriate Content
Thanks, but this is not exactly what I need.
With the above conditional expression, holiday lines (yellow ones) totally disappeare when I choose project 1 or 2.
I want to see only the 3 employees that worked on this or that project, but I also want to see their Leave hours (not just the plan or actual).
Any idea?
- Mark as New
- Bookmark
- Subscribe
- Mute
- Subscribe to RSS Feed
- Permalink
- Report Inappropriate Content
Ok, you can try to change the EmployeeID dimension to a calculated dimension like:
=Aggr(Only(EmployeeID), EmployeeID)
so it only shows the employeeid included in current selections.
- Mark as New
- Bookmark
- Subscribe
- Mute
- Subscribe to RSS Feed
- Permalink
- Report Inappropriate Content
Sorry, I was distracted on some other projects.
and wanted to check this before I give feedback
Thanks, it works fine. Also, I checked the Suppress When Value is Null checkbox to make the last Line disappear (that aggregated holiday for the rest of people not working on the project in qestion).
Thank you for your quick and efficient solution!