Unlock a world of possibilities! Login now and discover the exclusive benefits awaiting you.
- Qlik Community
- :
- All Forums
- :
- QlikView App Dev
- :
- Re: Set Analysis using Greater than with Distinct ...
- Subscribe to RSS Feed
- Mark Topic as New
- Mark Topic as Read
- Float this Topic for Current User
- Bookmark
- Subscribe
- Mute
- Printer Friendly Page
- Mark as New
- Bookmark
- Subscribe
- Mute
- Subscribe to RSS Feed
- Permalink
- Report Inappropriate Content
Set Analysis using Greater than with Distinct Values
So here is the long and short of it.
I have a table with a list of assets (AssetName) and A Chart that I would like to display the count of Distinct Assets by month (regardless of selections.
Count({$<Month=>} Distinct AssetName))
No Problem - Works flawlessly.
Now I would like to count a subset of that population based on the comparison of two other fields for each distinct AssetName
Field One = CycleTime
Field Two = DesignTime
I tried something like Count({$<Month=>,CycleTime={">DesignTime"}>} Distinct AssetName)), but nothing. I tried a few variations using Aggr, to no avail.
Can Anyone Help?
- « Previous Replies
-
- 1
- 2
- Next Replies »
- Mark as New
- Bookmark
- Subscribe
- Mute
- Subscribe to RSS Feed
- Permalink
- Report Inappropriate Content
Hi Robert. If DesignTime has the only value try this
Count({$<Month=>,CycleTime={">$(=DesignTime)"}>} Distinct AssetName))
and check the DateTime format of these fields, it should be the same
another case something like this
Count({$<Month=>,CycleTime={">$(=Date(Max(DesignTime)))"}>} Distinct AssetName))
- Mark as New
- Bookmark
- Subscribe
- Mute
- Subscribe to RSS Feed
- Permalink
- Report Inappropriate Content
You can also try this
Count({$<Month, AssetName = {"=CycleTime > DesignTime"}>} DISTINCT AssetName)
- Mark as New
- Bookmark
- Subscribe
- Mute
- Subscribe to RSS Feed
- Permalink
- Report Inappropriate Content
Hi Sunny, I think it is perfect in some cases. I have to try it somewhere)
- Mark as New
- Bookmark
- Subscribe
- Mute
- Subscribe to RSS Feed
- Permalink
- Report Inappropriate Content
I think this will work only if AssetName can only have a single unique value of CycleTime and DesignTime. If this is not true, then we would need a sample to determine what exactly is needed.
- Mark as New
- Bookmark
- Subscribe
- Mute
- Subscribe to RSS Feed
- Permalink
- Report Inappropriate Content
The following is a sample table of data for the Set Analysis in question:
| AssetName | ShiftDate | Month | Cycle Time | DesignTime |
| Asset.One | 8/2/2018 | Aug | 49.6 | 42.7 |
| Asset.One | 8/3/2018 | Aug | 56.7 | 42.7 |
| Asset.One | 8/4/2018 | Aug | 55.1 | 42.7 |
| Asset.One | 9/1/2018 | Sep | 56.8 | 42.7 |
| Asset.One | 9/2/2018 | Sep | 53.5 | 42.7 |
| Asset.One | 9/3/2018 | Sep | 66.6 | 42.7 |
| Asset.Two | 8/2/2018 | Aug | 53.2 | 42.7 |
| Asset.Two | 8/3/2018 | Aug | 58.2 | 42.7 |
| Asset.Two | 8/4/2018 | Aug | 50.5 | 42.7 |
| Asset.Two | 8/5/2018 | Aug | 41.5 | 42.7 |
| Asset.Two | 9/1/2018 | Sep | 52.7 | 42.7 |
| Asset.Two | 9/2/2018 | Sep | 51.0 | 42.7 |
| Asset.Two | 9/3/2018 | Sep | 62.3 | 42.7 |
| Asset.Two | 9/4/2018 | Sep | 47.2 | 42.7 |
| Asset.Three | 8/2/2018 | Aug | 24.7 | 42.7 |
| Asset.Three | 8/3/2018 | Aug | 24.6 | 42.7 |
| Asset.Three | 8/4/2018 | Aug | 24.5 | 42.7 |
| Asset.Three | 8/5/2018 | Aug | 24.8 | 42.7 |
| Asset.Three | 9/1/2018 | Sep | 24.5 | 42.7 |
| Asset.Three | 9/2/2018 | Sep | 24.7 | 42.7 |
| Asset.Three | 9/3/2018 | Sep | 24.6 | 42.7 |
| Asset.Three | 9/4/2018 | Sep | 24.6 | 42.7 |
| Asset.Four | 8/2/2018 | Aug | 38.2 | 42.7 |
| Asset.Four | 8/3/2018 | Aug | 37.7 | 42.7 |
| Asset.Four | 8/4/2018 | Aug | 39.7 | 42.7 |
| Asset.Four | 8/5/2018 | Aug | 38.2 | 42.7 |
| Asset.Four | 9/1/2018 | Sep | 39.6 | 42.7 |
| Asset.Four | 9/2/2018 | Sep | 39.7 | 42.7 |
| Asset.Four | 9/3/2018 | Sep | 39.0 | 42.7 |
| Asset.Four | 9/4/2018 | Sep | 39.0 | 42.7 |
| Asset.Five | 8/2/2018 | Aug | 34.4 | 42.7 |
| Asset.Five | 8/3/2018 | Aug | 40.6 | 42.7 |
| Asset.Five | 8/4/2018 | Aug | 33.2 | 42.7 |
| Asset.Five | 8/5/2018 | Aug | 48.4 | 42.7 |
| Asset.Five | 9/1/2018 | Sep | 35.8 | 42.7 |
| Asset.Five | 9/2/2018 | Sep | 36.2 | 42.7 |
| Asset.Five | 9/3/2018 | Sep | 35.4 | 42.7 |
| Asset.Five | 9/4/2018 | Sep | 36.8 | 42.7 |
| Asset.Six | 8/2/2018 | Aug | 38.5 | 42.7 |
| Asset.Six | 8/3/2018 | Aug | 38.5 | 42.7 |
| Asset.Six | 8/4/2018 | Aug | 38.7 | 42.7 |
| Asset.Six | 8/5/2018 | Aug | 38.3 | 42.7 |
| Asset.Six | 9/1/2018 | Sep | 39.1 | 42.7 |
| Asset.Six | 9/2/2018 | Sep | 39.4 | 42.7 |
| Asset.Six | 9/3/2018 | Sep | 39.2 | 42.7 |
| Asset.Six | 9/4/2018 | Sep | 39.0 | 42.7 |
| Asset.Seven | 8/2/2018 | Aug | 26.5 | 42.7 |
| Asset.Seven | 8/3/2018 | Aug | 26.3 | 42.7 |
| Asset.Seven | 8/4/2018 | Aug | 26.4 | 42.7 |
| Asset.Seven | 8/5/2018 | Aug | 26.5 | 42.7 |
| Asset.Seven | 9/1/2018 | Sep | 26.4 | 42.7 |
| Asset.Seven | 9/2/2018 | Sep | 26.6 | 42.7 |
| Asset.Seven | 9/3/2018 | Sep | 26.5 | 42.7 |
| Asset.Seven | 9/4/2018 | Sep | 26.4 | 42.7 |
| Asset.Eight | 8/2/2018 | Aug | 41.0 | 42.7 |
| Asset.Eight | 8/3/2018 | Aug | 40.5 | 42.7 |
| Asset.Eight | 8/4/2018 | Aug | 42.3 | 42.7 |
| Asset.Eight | 8/5/2018 | Aug | 41.3 | 42.7 |
| Asset.Eight | 9/1/2018 | Sep | 42.0 | 42.7 |
| Asset.Eight | 9/2/2018 | Sep | 42.2 | 42.7 |
| Asset.Eight | 9/3/2018 | Sep | 41.7 | 42.7 |
| Asset.Eight | 9/4/2018 | Sep | 41.9 | 42.7 |
| Asset.Nine | 8/2/2018 | Aug | 36.5 | 42.7 |
| Asset.Nine | 8/3/2018 | Aug | 38.6 | 42.7 |
| Asset.Nine | 8/4/2018 | Aug | 30.2 | 42.7 |
| Asset.Nine | 8/5/2018 | Aug | 43.0 | 42.7 |
| Asset.Nine | 9/1/2018 | Sep | 35.1 | 42.7 |
| Asset.Nine | 9/2/2018 | Sep | 33.8 | 42.7 |
| Asset.Nine | 9/3/2018 | Sep | 29.3 | 42.7 |
| Asset.Nine | 9/4/2018 | Sep | 35.4 | 42.7 |
| Asset.Ten | 8/2/2018 | Aug | 39.4 | 42.7 |
| Asset.Ten | 8/3/2018 | Aug | 39.1 | 42.7 |
| Asset.Ten | 8/4/2018 | Aug | 40.1 | 42.7 |
| Asset.Ten | 8/5/2018 | Aug | 39.1 | 42.7 |
| Asset.Ten | 9/1/2018 | Sep | 40.2 | 42.7 |
| Asset.Ten | 9/2/2018 | Sep | 40.3 | 42.7 |
| Asset.Ten | 9/3/2018 | Sep | 40.2 | 42.7 |
| Asset.Ten | 9/4/2018 | Sep | 39.8 | 42.7 |
Ultimately I would like to count how many assets each month area Cycling Slower (Cycle Time) than the Design Cycle Time (Design Time)
- Mark as New
- Bookmark
- Subscribe
- Mute
- Subscribe to RSS Feed
- Permalink
- Report Inappropriate Content
May be try this?
Count(TOTAL <Month> {<AssetName = {"=[Cycle Time] > [DesignTime]"}>} DISTINCT AssetName)
- Mark as New
- Bookmark
- Subscribe
- Mute
- Subscribe to RSS Feed
- Permalink
- Report Inappropriate Content
Hello Robert,
Use following set expression (not sure correct 100% but it is working perfectly).
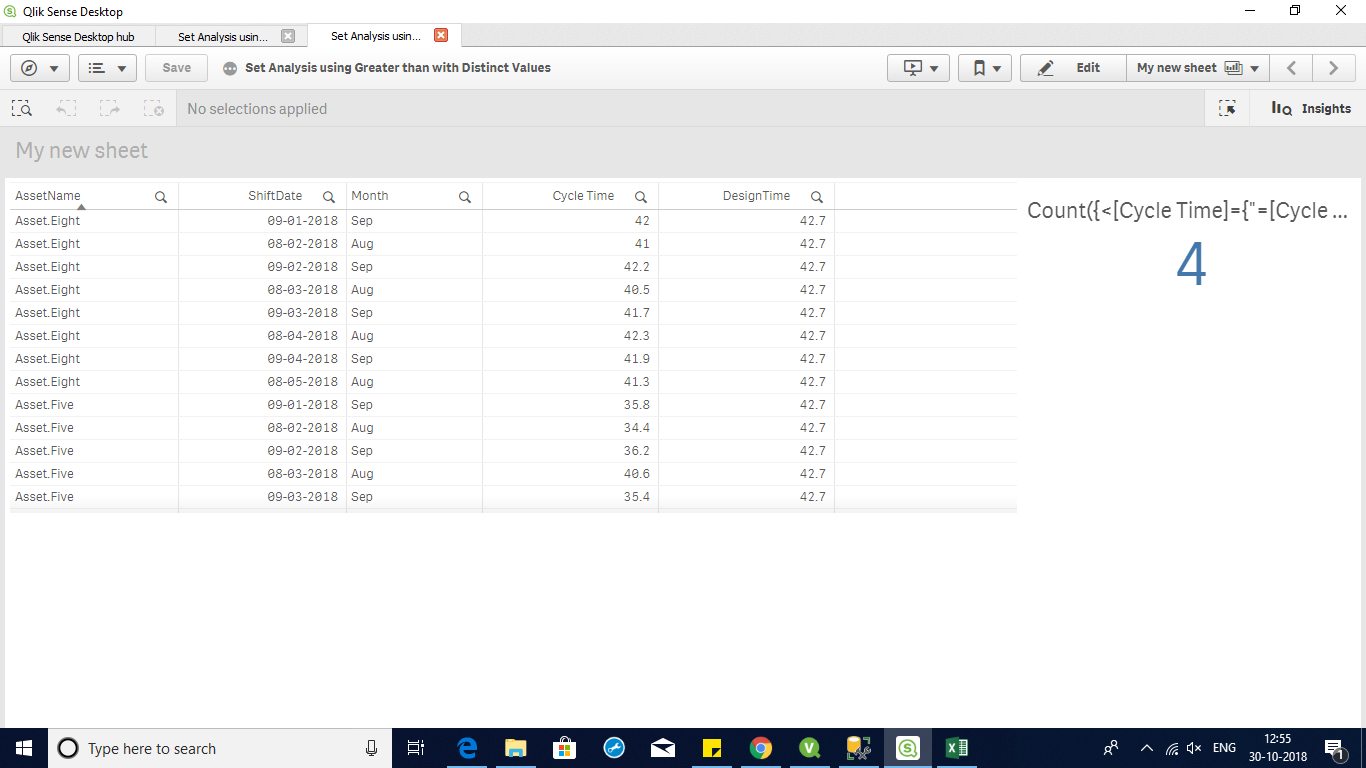
Count({<[Cycle Time]={"=[Cycle Time] > DesignTime"}>} distinct AssetName)
- Mark as New
- Bookmark
- Subscribe
- Mute
- Subscribe to RSS Feed
- Permalink
- Report Inappropriate Content
Hi Robert,
As I understand in your table you have following fields:
AssetName
CycleTime
DesignTime
If so, you can create Flag in the script load:
Load
AssetName,
CycleTime,
DesignTime,
If(CycleTime > DesignTime, 1, 0) AS Flag
From ...
After this you will be able to use Flag in the Set Analysis:
Count({$<Month =, Flag = {1}>} DISTINCT AssetName)
From my point of view this solution will have better performance and of course in this case it's easier to write set expression.
Thanks,
Vitalii
- Mark as New
- Bookmark
- Subscribe
- Mute
- Subscribe to RSS Feed
- Permalink
- Report Inappropriate Content
Asset.Two was slower on 8/5/2018, but was faster on the other days of August. Do you want this to be counted or not?
- « Previous Replies
-
- 1
- 2
- Next Replies »