Unlock a world of possibilities! Login now and discover the exclusive benefits awaiting you.
- Qlik Community
- :
- All Forums
- :
- QlikView App Dev
- :
- Set analysis. Using monthdate to calculate stock
- Subscribe to RSS Feed
- Mark Topic as New
- Mark Topic as Read
- Float this Topic for Current User
- Bookmark
- Subscribe
- Mute
- Printer Friendly Page
- Mark as New
- Bookmark
- Subscribe
- Mute
- Subscribe to RSS Feed
- Permalink
- Report Inappropriate Content
Set analysis. Using monthdate to calculate stock
Hi there.
Pretty new to QS and I'd really appreciate your help.
I'm trying to calculate the stock of products labelled in group 1 by the end of each month (the dimension will show the last day of each month).
What I need to set is as follows:
- Each product has a purchase date and a selling date.
- For each reference, if by the end of each month the purchase date is previous to that moment and the selling date isn't, then that reference will be part of the stock.
I'm trying (unsuccessfully) something like:
count({$<group={1}, adquisition_date={"<=$(MonthEnd(?????))"}, selling_date-={"<=$(MonthEnd(?????)"}>}product_reference)
Thank you.
M.
- Mark as New
- Bookmark
- Subscribe
- Mute
- Subscribe to RSS Feed
- Permalink
- Report Inappropriate Content
If there is something else I can add to clarify the situation or whatever needs to be considered on my side please ask.
Also, if you think my approach is wrong, I'd appreciate any comment very much.
Thanks.
- Mark as New
- Bookmark
- Subscribe
- Mute
- Subscribe to RSS Feed
- Permalink
- Report Inappropriate Content
Hi,
Please share the dimension you need to take and the date fields. I understood that you need to calculate MTD sales. If not please let me know what exactly you need to achieve.
Regards
Krishna
- Mark as New
- Bookmark
- Subscribe
- Mute
- Subscribe to RSS Feed
- Permalink
- Report Inappropriate Content
Hi, Krishna.
Thanks for replying.
Data available
Fields
- product_reference: unique id for each product. There's only one unit of every product
- purchase_date (of the product)
- selling_date (of the product)
- product_group: just a product classfication
Example:
| product_reference | purchase_date | selling_date | product_group |
| 29.12.2894 | 29/01/14 | 1 | |
| 18.11.2895 | 29/01/14 | 3 | |
| 41.9.2896 | 30/01/14 | 24/04/2014 | 1 |
| 21.10.2897 | 31/03/14 | 02/04/2014 | 3 |
| 15.10.2898 | 31/03/14 | 3 | |
| 12.8.2899 | 31/03/14 | 03/04/2014 | 1 |
| 26.4.2900 | 31/03/14 | 17/11/2014 | 1 |
| 41.9.2901 | 31/03/14 | 24/04/2014 | 4 |
| 26.9.2902 | 31/03/14 | 07/04/2014 | 1 |
| 42.8.2903 | 31/03/14 | 3 | |
| 15.8.2904 | 31/03/14 | 3 | |
| 15.9.2905 | 31/03/14 | 02/04/2014 | 4 |
| 18.7.2906 | 31/03/14 | 26/05/2014 | 5 |
| 14.8.2907 | 31/03/14 | 2 | |
| 15.8.2908 | 31/03/14 | 3 | |
| 41.7.2909 | 31/03/14 | 4 | |
| 15.10.2910 | 31/03/14 | 2 |
Note: those products with blank selling date have not still been sold (to the present date), so they're part of the stock.
Note 2: for example, product 41.9.2896, in line 3 would be part of the stock on 31/01, 28/02 and 31/03 but not on 30/03, because it was sold the 24th of April.
Dimension
| end_month |
| 31/01 |
| 28/02 |
| 31/03 |
| 30/04 |
| 31/05 |
| 30/06 |
| 31/07 |
| 31/08 |
| 30/09 |
| 31/10 |
| 30/11 |
| 31/12 |
| 31/01 |
| 28/02 |
| 31/03 |
| 30/04 |
| 31/05 |
| 30/06 |
What I'm looking for
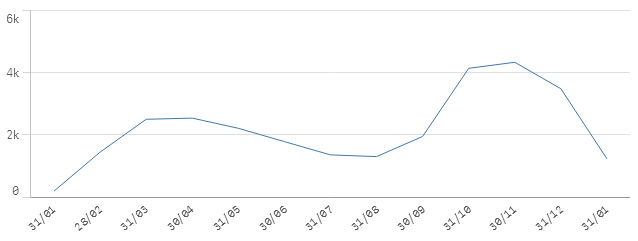
A graph showing different lines, each one related to a product_group and the variation of product units through time.
Example:
Thanks anyway!
- Mark as New
- Bookmark
- Subscribe
- Mute
- Subscribe to RSS Feed
- Permalink
- Report Inappropriate Content
Hi ,
Are you focusing to show the counts for Product_Reference in the condition Product_group =1 only or for all products?
Because, you have mentioned before like this
count({$<group={1}, adquisition_date={"<=$(MonthEnd(?????))"}, selling_date-={"<=$(MonthEnd(?????)"}>}product_reference)
Regards
Krishna
- Mark as New
- Bookmark
- Subscribe
- Mute
- Subscribe to RSS Feed
- Permalink
- Report Inappropriate Content
Please don't consider my initial statement because, due to my lack of knowledge, I've surely written something incorrect.
What I'd want to plot is what I explain in my reply:
- One line for each group, showing what the stock was for each group at the end of each month (in the image posted there's only one line, as an example).
- And the stock is the addition (counting) of all the references of the same group, considering its purchasing and selling dates as explained before.
Thanks.
M.