Unlock a world of possibilities! Login now and discover the exclusive benefits awaiting you.
- Qlik Community
- :
- All Forums
- :
- QlikView App Dev
- :
- Set analysis for calculating Growth YoY
- Subscribe to RSS Feed
- Mark Topic as New
- Mark Topic as Read
- Float this Topic for Current User
- Bookmark
- Subscribe
- Mute
- Printer Friendly Page
- Mark as New
- Bookmark
- Subscribe
- Mute
- Subscribe to RSS Feed
- Permalink
- Report Inappropriate Content
Set analysis for calculating Growth YoY
Hi,
I have a list box of year and month, on selecting for example February 2014 and March 2014 , it should show me (sum of sales in Feb +March2014 ) -(sum of sales in Fwb +March2013 ) for the previous year. how do i write set analysis expression for it. Also, is there any reference where i can learn to write these expressions and get a know about functions used in qlikview.
Thanks in advance.
- « Previous Replies
-
- 1
- 2
- Next Replies »
- Mark as New
- Bookmark
- Subscribe
- Mute
- Subscribe to RSS Feed
- Permalink
- Report Inappropriate Content
Hi,
Try like this;
SUM({<PERIOD={"$(=MAX(PERIOD))"}>}Sales)
-
SUM({<PERIOD={"$(=MAX(PERIOD)-1)"}>}Sales)
Here PERIOD means your year in master calender.
Regards,
Ajay
- Mark as New
- Bookmark
- Subscribe
- Mute
- Subscribe to RSS Feed
- Permalink
- Report Inappropriate Content
Well, in period i want month as well as year, how will it be done ? 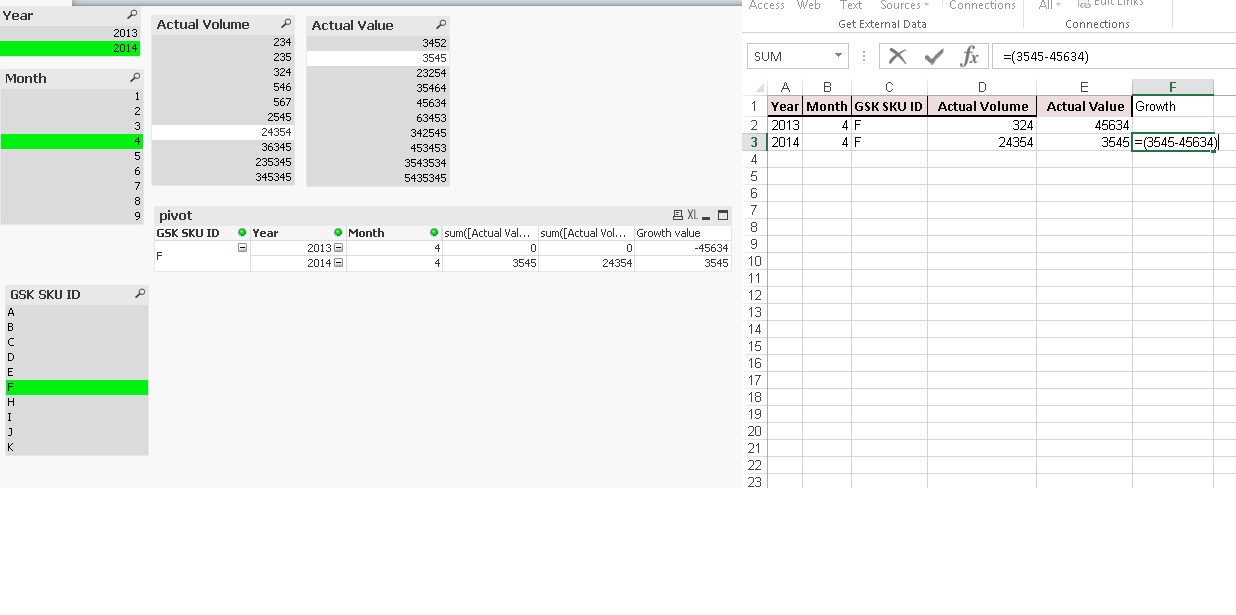
- Mark as New
- Bookmark
- Subscribe
- Mute
- Subscribe to RSS Feed
- Permalink
- Report Inappropriate Content
Hi,
Try like;
SUM({<Month = {"$(=max(Month))"},PERIOD={"$(=MAX(PERIOD))"}>}Sales)
-
SUM({<Month={"$(=MAX(Month)-1)"},PERIOD={"$(=MAX(PERIOD)-1)"}>}Sales)
Share your sample app .I will check.
- Mark as New
- Bookmark
- Subscribe
- Mute
- Subscribe to RSS Feed
- Permalink
- Report Inappropriate Content
Hi,
Try like this
Script:
LOAD
*,
MakeDate(Year, Month) AS Date
FROM DataSource;
Now in Set Analysis
SUM({<Year=, Month =, Date= {">=$(=MonthStart(Max(Date)))<=$(=MonthEnd(Max(Date)))"}>}Sales)
-
SUM({<Year=, Month =, Date= {">=$(=MonthStart(Max(Date), -1))<=$(=MonthEnd(Max(Date), -1))"}>}Sales)
Hope this helps you.
Regards,
Jagan.
- Mark as New
- Bookmark
- Subscribe
- Mute
- Subscribe to RSS Feed
- Permalink
- Report Inappropriate Content
Check this out,
- Mark as New
- Bookmark
- Subscribe
- Mute
- Subscribe to RSS Feed
- Permalink
- Report Inappropriate Content
it shows only the sales value in growth and doesnt calculate anything on single/multiple selection of months .
- Mark as New
- Bookmark
- Subscribe
- Mute
- Subscribe to RSS Feed
- Permalink
- Report Inappropriate Content
CY :
SUM({$<FiscalYear={$(=max(FiscalYear))},Quarter=
,[Posting Date]={">=$(=YearStart(max({$<FiscalYear={$(=max(FiscalYear))}>}[Posting Date]),0,4))<=$(=max({$<FiscalYear={$(=max(FiscalYear))}>}[Posting Date]))"}>}[Sales Amount])
LY:
Sum({$<FinancialYear=,FiscalYear={$(=max(FiscalYear)-1)}
,[Posting Date]={">=$(=YearStart(max({$<FiscalYear={$(=max(FiscalYear))}>}[Posting Date]),-1,4))<=$(=addmonths(max({$<FiscalYear={$(=max(FiscalYear))}>}[Posting Date]),-12))"}
>} [ Sales Amount])
for Growth
((Column(1)-Column(2))/Column (2))*100
Hope this helps you
Vikas
If the issue is solved please mark the answer with Accept as Solution & like it.
If you want to go quickly, go alone. If you want to go far, go together.
- Mark as New
- Bookmark
- Subscribe
- Mute
- Subscribe to RSS Feed
- Permalink
- Report Inappropriate Content
Can you please attach your sample qvw file.
Moreover, looking at the screenshot, it seems like in Growth column you need like
2013 >> 0
2014 >> Value(2014)-Value(2013)
So you have to use Above() function in the chart expression to achieve this.
Thanks,
Singh
- Mark as New
- Bookmark
- Subscribe
- Mute
- Subscribe to RSS Feed
- Permalink
- Report Inappropriate Content
Hi,
Try like this
Script:
LOAD
*,
MakeDate(Year, Month) AS Date
FROM DataSource;
Now in Set Analysis
SUM({<Year=, Month =, Date= {">=$(=MonthStart(Min(Date)))<=$(=MonthEnd(Max(Date)))"}>}Sales)
-
SUM({<Year=, Month =, Date= {">=$(=MonthStart(Min(Date), -12))<=$(=MonthEnd(Max(Date), -12))"}>}Sales)
Hope this helps you.
Regards,
Jagan.
- « Previous Replies
-
- 1
- 2
- Next Replies »