Unlock a world of possibilities! Login now and discover the exclusive benefits awaiting you.
- Qlik Community
- :
- All Forums
- :
- QlikView App Dev
- :
- Set analysis for text object and stack charts sepe...
Options
- Subscribe to RSS Feed
- Mark Topic as New
- Mark Topic as Read
- Float this Topic for Current User
- Bookmark
- Subscribe
- Mute
- Printer Friendly Page
Turn on suggestions
Auto-suggest helps you quickly narrow down your search results by suggesting possible matches as you type.
Showing results for
Anonymous
Not applicable
2015-10-29
02:35 AM
- Mark as New
- Bookmark
- Subscribe
- Mute
- Subscribe to RSS Feed
- Permalink
- Report Inappropriate Content
Set analysis for text object and stack charts seperately
Hi everyone,
I am trying to create stack charts with text object as summary KPI. The text object does not show the correct numbers as expected using the status selection on the top i.e GREEN being selection. The other dimensions are working fine.
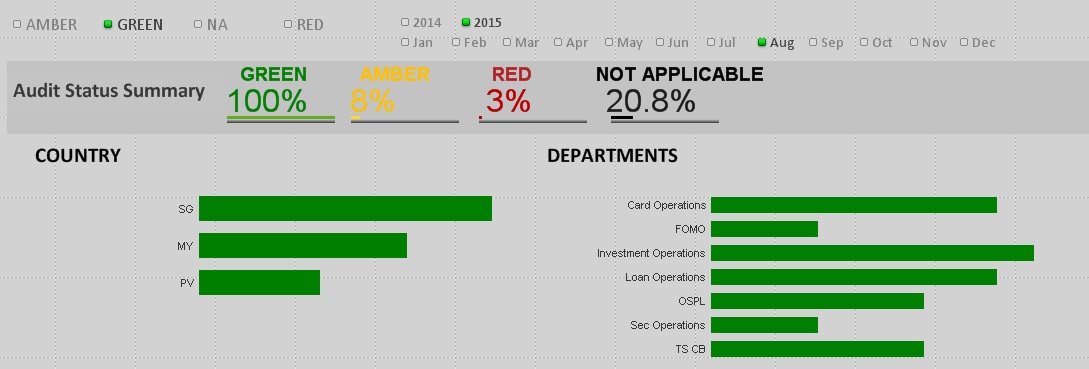
1. Is there anything with expression used in the object?
=num(Count ({$<[STATUS] = {'GREEN'}>} [STATUS])/Count ({$}[STATUS]),'###%')
2. Is there any workaround design to make both text object and stack chart work well together?
Regards,
Nelson
253 Views
0 Replies