Unlock a world of possibilities! Login now and discover the exclusive benefits awaiting you.
- Qlik Community
- :
- All Forums
- :
- QlikView App Dev
- :
- Show last 13 months based on current month
- Subscribe to RSS Feed
- Mark Topic as New
- Mark Topic as Read
- Float this Topic for Current User
- Bookmark
- Subscribe
- Mute
- Printer Friendly Page
- Mark as New
- Bookmark
- Subscribe
- Mute
- Subscribe to RSS Feed
- Permalink
- Report Inappropriate Content
Show last 13 months based on current month
Hi. me again.
i have quite a few charts and KPIs but for a particular chart, i want to show the last 13 months vols only - as its currently showing all dates.
Now i have got a master calendar (which i borrowed from elsewhere), which is coded as follows, and i don't really want to mess with it, as its used elsewhere to give me date ranges etc:
MasterCalendar:
Load
TempDate AS Create_Month,
week(TempDate) As Week,
Year(TempDate) As Year,
Month(TempDate) As Month,
Day(TempDate) As Day,
'Q' & ceil(month(TempDate) / 3) AS Quarter,
Week(weekstart(TempDate)) & '-' & WeekYear(TempDate) as WeekYear,
WeekDay(TempDate) as WeekDay;
//=== Generate a temp table of dates ===
LOAD
date(mindate + IterNo()) AS TempDate
,maxdate // Used in InYearToDate() above, but not kept
WHILE mindate + IterNo() <= maxdate;
//=== Get min/max dates from Field ===/
LOAD
min(FieldValue('Create_Month', recno()))-1 as mindate,
max(FieldValue('Create_Month', recno())) as maxdate
AUTOGENERATE FieldValueCount('Create_Month');
is there a way to apply a rule to a specific chart to show the last 13 months as an expression or something?
Any advice appreciated
- « Previous Replies
-
- 1
- 2
- Next Replies »
Accepted Solutions
- Mark as New
- Bookmark
- Subscribe
- Mute
- Subscribe to RSS Feed
- Permalink
- Report Inappropriate Content
When you use a time unit, in your case "Create_Month", as dimension in a bar chart or line chart, you can use a calculated dimension instead. If "Create_Month" contain 1, 2, 3 .. 12 and if you have a Year field containing 2015, 2016 etc. then you can use the expression in my previous reply as the calculated dimension.

You substitute the red Year, Month with your Year and Month fields adjust the -24 to -13.
If you want current month as the end month, then you substitute < MonthStart(Today()) with <= MonthEnd(Today())
The expression from my previous reply is:
=if(((MakeDate(Year,Month) < MonthStart(Today())) and (MakeDate(Year,Month) >= AddMonths(MonthStart(Today()),-24))),
Month(MakeDate(2000, Month, 1)) & ' ' & Year)
BR
Finn
- Mark as New
- Bookmark
- Subscribe
- Mute
- Subscribe to RSS Feed
- Permalink
- Report Inappropriate Content
Something like this ? Reference from Calculating rolling n-period totals, averages or other aggregations
= sum({<Month={'>=$(= Max(Month)-12) <=$(= Max(Month))'}>}Vol)
- Mark as New
- Bookmark
- Subscribe
- Mute
- Subscribe to RSS Feed
- Permalink
- Report Inappropriate Content
Vish what happens when a user selects month 3. It will show >=-9<=3. I think it is better to use Date or MonthYear field to show last 12 months based on selections.
Sum({<DateField = {"$(='>=' & Date(AddYears(Max(DateField), -1), 'DateFieldFormatHere') & '<=' & Date(Max(DateField), 'DateFieldFormatHere'))"}, Month, MonthNum, Year, Quarte, Week>}Vol)
- Mark as New
- Bookmark
- Subscribe
- Mute
- Subscribe to RSS Feed
- Permalink
- Report Inappropriate Content
Oh yeah, that is correct, I restricted my thoughts on that. Thanks for the update.
- Mark as New
- Bookmark
- Subscribe
- Mute
- Subscribe to RSS Feed
- Permalink
- Report Inappropriate Content
Not a problem man. I have been corrected for the same thing multiple times before I memorized to not make that same mistake again 
- Mark as New
- Bookmark
- Subscribe
- Mute
- Subscribe to RSS Feed
- Permalink
- Report Inappropriate Content
Hi
If you are trying to display to display last 13 months data based on current month you can try the below expression,
Sum({<[DATE]={">=$(=MonthStart(Today(),-12))<=$(=MonthEnd(Today())"} >}FieldName)
Regards
Harish
- Mark as New
- Bookmark
- Subscribe
- Mute
- Subscribe to RSS Feed
- Permalink
- Report Inappropriate Content
Hi - thanks for the reply.
I am still fairly new to Qlik - i'm just trying to work out where i can put this code to make it work? i assume its not in the script, but as an expression?
I attach a screen shot of the chart properties - where you will see i have create_month as the dimension, and reactive/proactive as the expression.
Just trying to understand where this code will work best?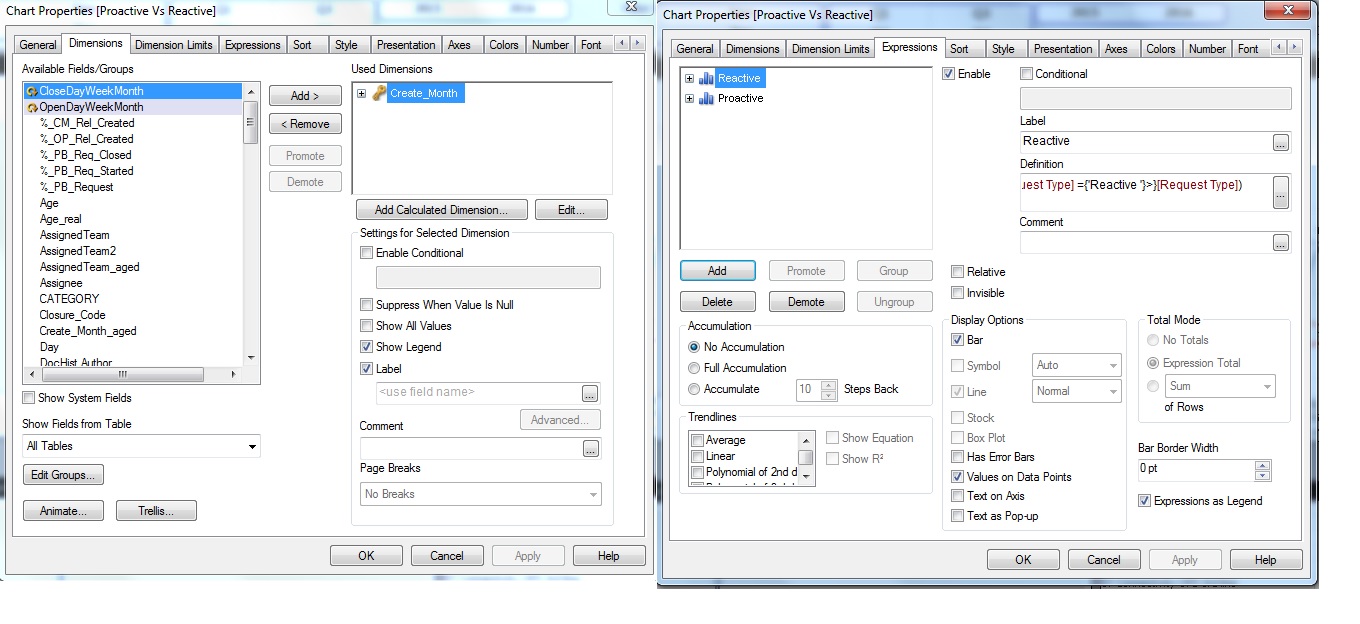
- Mark as New
- Bookmark
- Subscribe
- Mute
- Subscribe to RSS Feed
- Permalink
- Report Inappropriate Content
I am not sure what chart you want to show only the last 13 month, but I use a calculated dimension for such a chart.
In the data set I have Year and Month as fields and in this case I want to show last 24 full month (not current month)
=if(((MakeDate(Year,Month) < MonthStart(Today())) and (MakeDate(Year,Month) >= AddMonths(MonthStart(Today()),-24))),
Month(MakeDate(2000, Month, 1)) & ' ' & Year)

BR
Finn
- Mark as New
- Bookmark
- Subscribe
- Mute
- Subscribe to RSS Feed
- Permalink
- Report Inappropriate Content
In your initial thread you mentioned
" i want to show the last 13 months vols only - as its currently showing all dates."
What is vols here ? Is this some kind of calculation you are doing for Reactive or Proactive ?
- Mark as New
- Bookmark
- Subscribe
- Mute
- Subscribe to RSS Feed
- Permalink
- Report Inappropriate Content
When you use a time unit, in your case "Create_Month", as dimension in a bar chart or line chart, you can use a calculated dimension instead. If "Create_Month" contain 1, 2, 3 .. 12 and if you have a Year field containing 2015, 2016 etc. then you can use the expression in my previous reply as the calculated dimension.
You substitute the red Year, Month with your Year and Month fields adjust the -24 to -13.
If you want current month as the end month, then you substitute < MonthStart(Today()) with <= MonthEnd(Today())
The expression from my previous reply is:
=if(((MakeDate(Year,Month) < MonthStart(Today())) and (MakeDate(Year,Month) >= AddMonths(MonthStart(Today()),-24))),
Month(MakeDate(2000, Month, 1)) & ' ' & Year)
BR
Finn
- « Previous Replies
-
- 1
- 2
- Next Replies »