Unlock a world of possibilities! Login now and discover the exclusive benefits awaiting you.
- Qlik Community
- :
- All Forums
- :
- QlikView App Dev
- :
- Show last four values in bar chart
- Subscribe to RSS Feed
- Mark Topic as New
- Mark Topic as Read
- Float this Topic for Current User
- Bookmark
- Subscribe
- Mute
- Printer Friendly Page
- Mark as New
- Bookmark
- Subscribe
- Mute
- Subscribe to RSS Feed
- Permalink
- Report Inappropriate Content
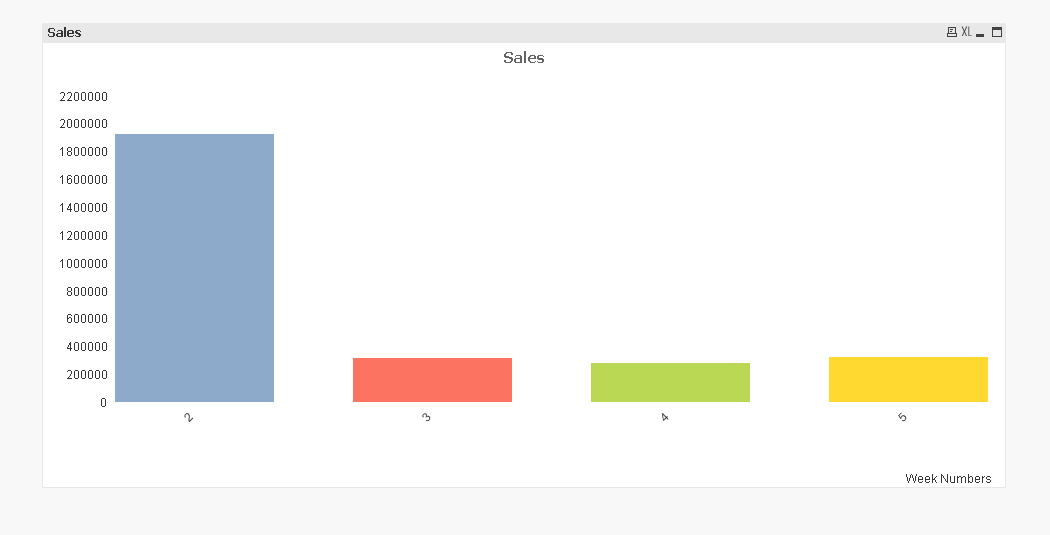
Show last four values in bar chart
I have bar chart with week number in x-axis.
I want to show last for weeks data. so how can i have that under dimension limits. it doesn't have last.
Thank You
- Tags:
- new_to_qlikview
Accepted Solutions
- Mark as New
- Bookmark
- Subscribe
- Mute
- Subscribe to RSS Feed
- Permalink
- Report Inappropriate Content
- Mark as New
- Bookmark
- Subscribe
- Mute
- Subscribe to RSS Feed
- Permalink
- Report Inappropriate Content
please attach some sample
If the issue is solved please mark the answer with Accept as Solution & like it.
If you want to go quickly, go alone. If you want to go far, go together.
- Mark as New
- Bookmark
- Subscribe
- Mute
- Subscribe to RSS Feed
- Permalink
- Report Inappropriate Content
Hi,
Check this links, hope it helps you.
Set Analysis for Rolling Periods
Set Analysis for certain Point in Time
Regards,
jagan.
- Mark as New
- Bookmark
- Subscribe
- Mute
- Subscribe to RSS Feed
- Permalink
- Report Inappropriate Content
Hi,
By this you can have a week view for last four weeks,
At Backend , In Your calendar pick your Date as,
Week(Date) as Week,
There by You an use this in the front end as dimension and you can pick largest or Smallest or First four in Dimension limits,
Or else in your Expression Your can write like this,
Sum( {<Date={">=$(=WeekStart(Max(Date), -3))<=$(=WeekStart(Max(Date)))"}>}Sales)
Hope this Helps,
PFA,
Regards,
HirisH
“Aspire to Inspire before we Expire!”
- Mark as New
- Bookmark
- Subscribe
- Mute
- Subscribe to RSS Feed
- Permalink
- Report Inappropriate Content
no, i have data based on weeks. i want to know how to display latest 4 weeks.
say i have 20 weeks, as 1-20 in x-axsis and i want to show week#16-week#20 only
- Mark as New
- Bookmark
- Subscribe
- Mute
- Subscribe to RSS Feed
- Permalink
- Report Inappropriate Content
i need last four. but it's not there. 
- Mark as New
- Bookmark
- Subscribe
- Mute
- Subscribe to RSS Feed
- Permalink
- Report Inappropriate Content
Sum({<Week={'>=$(=Max(Week)-4) <=$(=Max(Week))'}>}Data)
PFA
- Mark as New
- Bookmark
- Subscribe
- Mute
- Subscribe to RSS Feed
- Permalink
- Report Inappropriate Content
Hi,
Check the chages in my post now.
“Aspire to Inspire before we Expire!”