Unlock a world of possibilities! Login now and discover the exclusive benefits awaiting you.
- Qlik Community
- :
- All Forums
- :
- QlikView App Dev
- :
- Show most recent plotted value
- Subscribe to RSS Feed
- Mark Topic as New
- Mark Topic as Read
- Float this Topic for Current User
- Bookmark
- Subscribe
- Mute
- Printer Friendly Page
- Mark as New
- Bookmark
- Subscribe
- Mute
- Subscribe to RSS Feed
- Permalink
- Report Inappropriate Content
Show most recent plotted value
Hi,
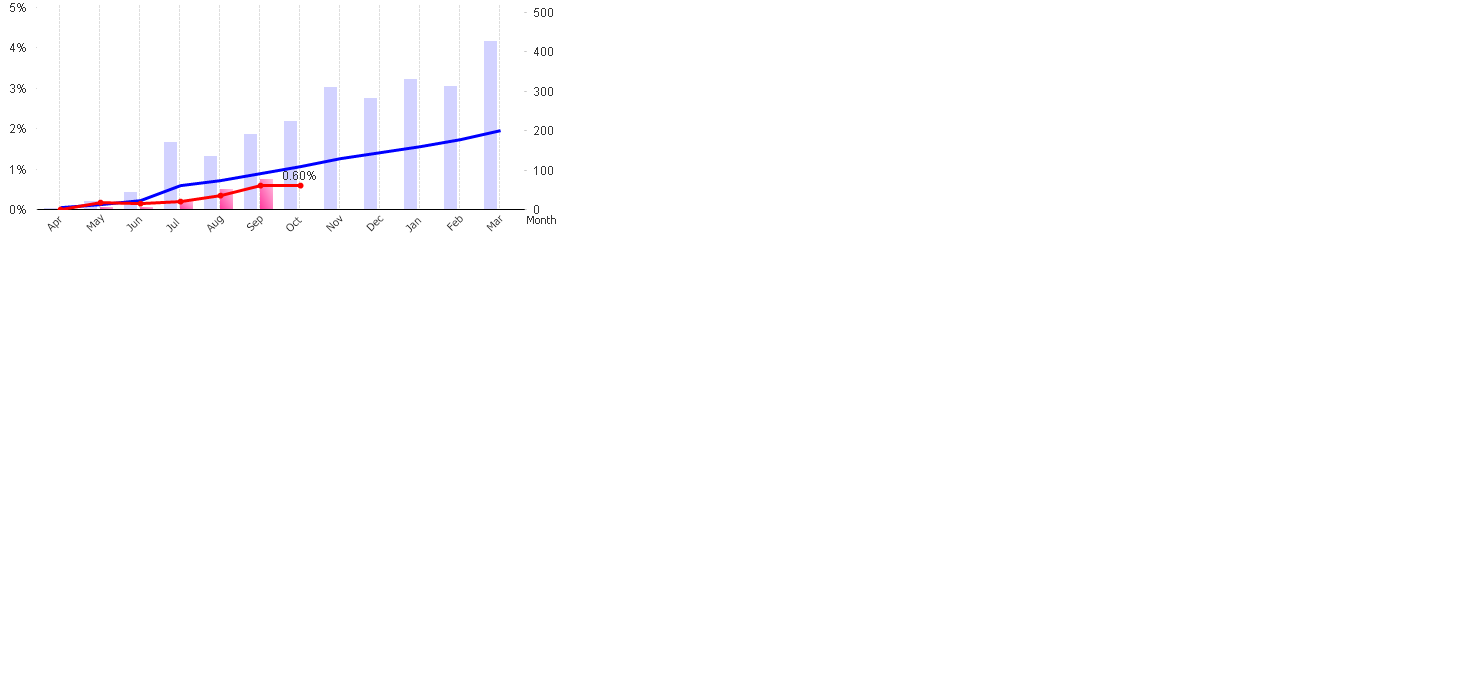
For red line, i am able to show the last plotted value,
but for blue line, the same expression used but the value didn't show up.
Red Line: if(Month = 'Oct', sum ({<FY ={'FY2018'} >}Job)/Sum ({<FY ={'FY2018'} >}Sales), '')
Blue Line: if (Month = 'Mar', sum ({<FY ={'FY2017'} >}Job)/Sum ({<FY ={'FY2017} >}Sales), '')
I have exported the data in excel to check, the point for blue line is calculated correctly, but nothing is shown.
Please assist.
Thank you.

- Mark as New
- Bookmark
- Subscribe
- Mute
- Subscribe to RSS Feed
- Permalink
- Report Inappropriate Content
Hello, Wendy!
Check the single quote here:
Blue Line: if (Month = 'Mar', sum ({<FY ={'FY2017'} >}Job)/Sum ({<FY ={'FY2017'} >}Sales), '')
- Mark as New
- Bookmark
- Subscribe
- Mute
- Subscribe to RSS Feed
- Permalink
- Report Inappropriate Content
Hi Tham,
you missed single quote symbol ' in the expression after the 2017',
so it need to be like below
Blue Line: if (Month = 'Mar', sum ({<FY ={'FY2017'} >}Job)/Sum ({<FY ={'FY2017'} >}Sales), '')
- Mark as New
- Bookmark
- Subscribe
- Mute
- Subscribe to RSS Feed
- Permalink
- Report Inappropriate Content
Hi,
Sorry, it's typo.
In QV, the expression is correct. There is double quote symbol.
- Mark as New
- Bookmark
- Subscribe
- Mute
- Subscribe to RSS Feed
- Permalink
- Report Inappropriate Content
I guess its because you are not showing Mar-2017 but Mar-2019 in the chart.
- Mark as New
- Bookmark
- Subscribe
- Mute
- Subscribe to RSS Feed
- Permalink
- Report Inappropriate Content
Have you tried selecting the Year FY = 2017 and see if plot value shows up otherwise try to change the calender dynamically
Blue Line: if (Month = 'Mar', sum ({<FY ={'FY2017'} >}Job)/Sum ({<FY ={'FY2017'} >}Sales), '')