Unlock a world of possibilities! Login now and discover the exclusive benefits awaiting you.
- Qlik Community
- :
- All Forums
- :
- QlikView App Dev
- :
- Re: Show time trending chart by clicking on existi...
- Subscribe to RSS Feed
- Mark Topic as New
- Mark Topic as Read
- Float this Topic for Current User
- Bookmark
- Subscribe
- Mute
- Printer Friendly Page
- Mark as New
- Bookmark
- Subscribe
- Mute
- Subscribe to RSS Feed
- Permalink
- Report Inappropriate Content
Show time trending chart by clicking on existing bar chart
Hi,
Want to build a chart and configure them in Worldview.
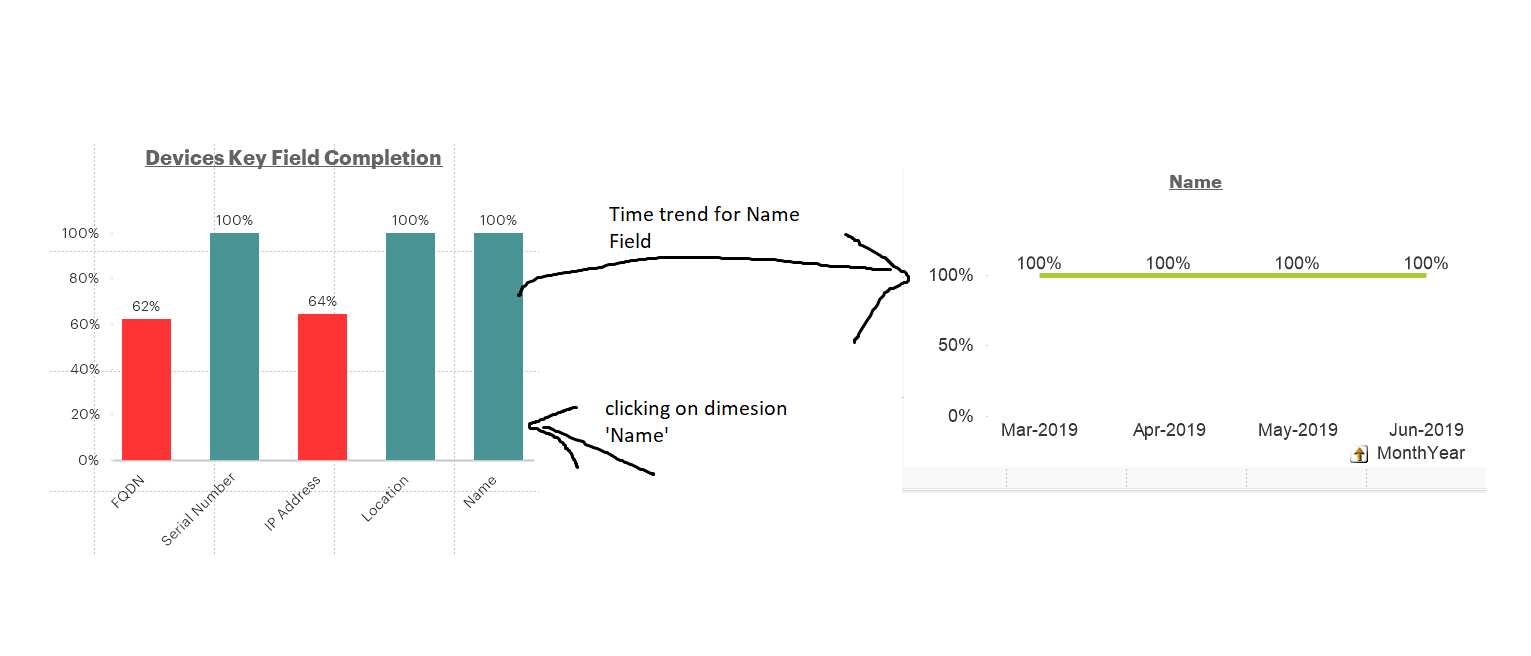
I have one bar chart which show all the blank value of all the Key fields(IP Address, Serial number, FQDN, Name, Location) with calculated dimension
by the using same key fields i want to make a time trend of all the key field which i am able to do by monthly and weekly but i want to configure both the chart in which if someone click on the dimension from the chart 1 then the chart 2 trending will be appear on the same sheet or may be at same location.
I have 5 calculated dimension and i tried with toggling and variable but not able to achieve my goal.
Thanks in advance
- Tags:
- bar chart
- calculated dimension
- chart
- chart configuration
- line chart
- new to qlikview
- new_to_qlikview
- object
- toggling
- trend chart
- trend line
- variable
- Mark as New
- Bookmark
- Subscribe
- Mute
- Subscribe to RSS Feed
- Permalink
- Report Inappropriate Content
@Deeksha Are you using QlikView or Qlik Sense? I would like to move this into the correct product forum as this one is mainly for general discussion around the community platform. Thanks
- Mark as New
- Bookmark
- Subscribe
- Mute
- Subscribe to RSS Feed
- Permalink
- Report Inappropriate Content
@Sue_Macaluso thank!
I am using QlikView
- Mark as New
- Bookmark
- Subscribe
- Mute
- Subscribe to RSS Feed
- Permalink
- Report Inappropriate Content
Deeksha, you are likely going to need to attach what you have in the way of the application/qvw file for folks to be able to help more, as it is tricky for folks without being able to see the actual data model you have etc....
About the best I have otherwise would be to have a look in the Design Blog area, you can search there:
https://community.qlik.com/t5/Qlik-Design-Blog/bg-p/qlik-design-blog
Regards,
Brett
I now work a compressed schedule, Tuesday, Wednesday and Thursday, so those will be the days I will reply to any follow-up posts.
- Mark as New
- Bookmark
- Subscribe
- Mute
- Subscribe to RSS Feed
- Permalink
- Report Inappropriate Content
In the layout tab of the first part, under conditional put: getselectedcount(dimension) = 0. then in the other chart put: getselectedcount(dimension) <> 0. I am not sure if your dimension is a field since it is calculated. if not you may be able to just put the formula for the calculated dimension in.