Unlock a world of possibilities! Login now and discover the exclusive benefits awaiting you.
- Qlik Community
- :
- All Forums
- :
- QlikView App Dev
- :
- Re: Showing all possible values in bar chart
- Subscribe to RSS Feed
- Mark Topic as New
- Mark Topic as Read
- Float this Topic for Current User
- Bookmark
- Subscribe
- Mute
- Printer Friendly Page
- Mark as New
- Bookmark
- Subscribe
- Mute
- Subscribe to RSS Feed
- Permalink
- Report Inappropriate Content
Showing all possible values in bar chart
I'm hoping someone can take a look at the attached for me.
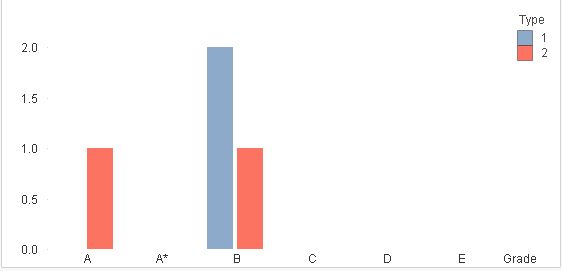
What I want is to select from the 'Cat & SubCat' list box, and for the chart to show all possible grades for that 'Cat' along the X axis (obviously many of them will be null values).
For example, when I select 'A English', I should see A* - E along X axis, but with values only for 'A' and 'B'
Have tried various JOINS/KEEP functions in script, but still no joy!
I also don't want to bring 'Type C' from the 'Possible' table into the data - so I only want to join the Types that appear in the 'Main' table.
Thanks,
Jess
- « Previous Replies
-
- 1
- 2
- Next Replies »
Accepted Solutions
- Mark as New
- Bookmark
- Subscribe
- Mute
- Subscribe to RSS Feed
- Permalink
- Report Inappropriate Content
- Mark as New
- Bookmark
- Subscribe
- Mute
- Subscribe to RSS Feed
- Permalink
- Report Inappropriate Content
Like this?

- Mark as New
- Bookmark
- Subscribe
- Mute
- Subscribe to RSS Feed
- Permalink
- Report Inappropriate Content
Not quite, because 'M' and 'P' don't belong to 'Cat A'.
So the chart you're showing, but without M or P.
- Mark as New
- Bookmark
- Subscribe
- Mute
- Subscribe to RSS Feed
- Permalink
- Report Inappropriate Content
But, If we are doing suppress then P and M should come right? i am not sure i followed you..
- Mark as New
- Bookmark
- Subscribe
- Mute
- Subscribe to RSS Feed
- Permalink
- Report Inappropriate Content
So when I select 'A English', it is coming from Cat 'A'.
The only possible values for Cat 'A' are:
A*
A
B
C
D
E
So I would like to see all of those values on the X axis.
- Mark as New
- Bookmark
- Subscribe
- Mute
- Subscribe to RSS Feed
- Permalink
- Report Inappropriate Content
Can you map the table using ApplyMap ‒ QlikView
And expression should this?
Count({<Type = $:: Type>} ID)
- Mark as New
- Bookmark
- Subscribe
- Mute
- Subscribe to RSS Feed
- Permalink
- Report Inappropriate Content
What should be the count for All possible values? A=4 or 1, B=5 or 3?
- Mark as New
- Bookmark
- Subscribe
- Mute
- Subscribe to RSS Feed
- Permalink
- Report Inappropriate Content
Sorry Kushal, I don't really understand your question.
Basically, the chart should show exactly as my attachment, except all possible values should be showing along the X axis.
Most values will be null, but A type 2 = 1, B type 1 = 2, B type 2 = 1
- Mark as New
- Bookmark
- Subscribe
- Mute
- Subscribe to RSS Feed
- Permalink
- Report Inappropriate Content
see the attached application
- Mark as New
- Bookmark
- Subscribe
- Mute
- Subscribe to RSS Feed
- Permalink
- Report Inappropriate Content
Thanks Kushal. Your solution involved a few more variables and syntax than I hoped, but works great.
Think I've managed to find a more straightforward solution. It leaves me with a synthetic table, but I'm hoping that won't cause too many issues!
- « Previous Replies
-
- 1
- 2
- Next Replies »