Unlock a world of possibilities! Login now and discover the exclusive benefits awaiting you.
- Qlik Community
- :
- All Forums
- :
- QlikView App Dev
- :
- Re: Showing graphic employee growth and forecast
- Subscribe to RSS Feed
- Mark Topic as New
- Mark Topic as Read
- Float this Topic for Current User
- Bookmark
- Subscribe
- Mute
- Printer Friendly Page
- Mark as New
- Bookmark
- Subscribe
- Mute
- Subscribe to RSS Feed
- Permalink
- Report Inappropriate Content
Showing graphic employee growth and forecast
Hi everyone,
Does anyone have any idea how to combine the two calendars in my data model? Im trying to show graphic projected MTD figures but was unsuccessful.
- Mark as New
- Bookmark
- Subscribe
- Mute
- Subscribe to RSS Feed
- Permalink
- Report Inappropriate Content
Hi Nelson,
Have you checked this out?
https://community.qlik.com/blogs/qlikviewdesignblog/2014/02/17/canonical-date
Please remember to mark this as helpful or the correct answer if I have helped you or answered your question.
- Mark as New
- Bookmark
- Subscribe
- Mute
- Subscribe to RSS Feed
- Permalink
- Report Inappropriate Content
Why do you need 2 calendars for?
I think with one calendar and a resident load from Master Calendar we can get your MTD. You need to have a common key between them.
I'm not an expert but I've checked your script and you're using date functions in almost every table. I do not understand why?
Can you be specific on what you trying to achieve?
Break down your requirements for me please?
- Mark as New
- Bookmark
- Subscribe
- Mute
- Subscribe to RSS Feed
- Permalink
- Report Inappropriate Content
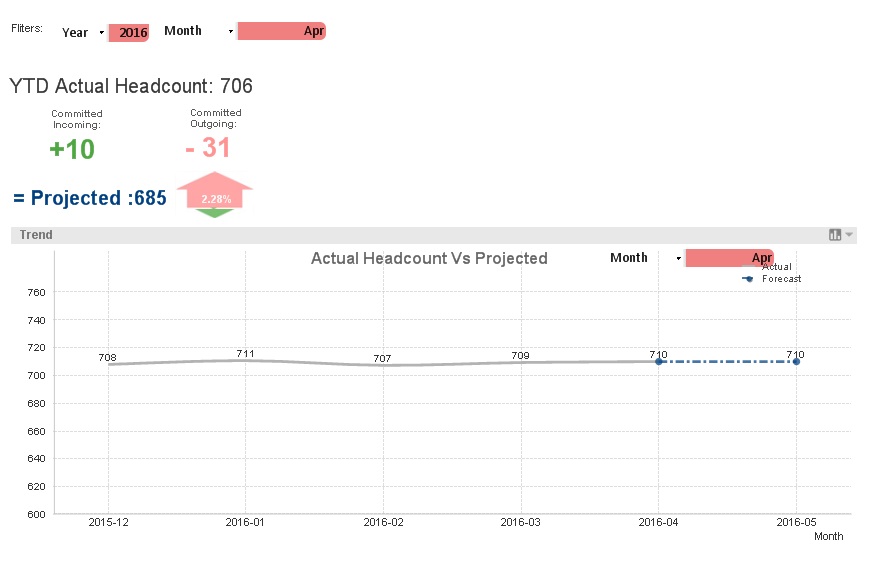
The second calendar logic is able to show actual and projected figures in line chart.
What i am trying to achieve is here is to translate what is shown in the text object into line chart under the same master calendar logic.
- Mark as New
- Bookmark
- Subscribe
- Mute
- Subscribe to RSS Feed
- Permalink
- Report Inappropriate Content
Ok, In that case maybe you can create a second master calendar and rename the fields if they are matching your original master. And use DateID or just one Primary key (Date) to link both 1st and 2nd master calendar.
I don;t know if that would be helpful or no?