Unlock a world of possibilities! Login now and discover the exclusive benefits awaiting you.
- Qlik Community
- :
- All Forums
- :
- QlikView App Dev
- :
- Simple Layout Issue in LineChart
- Subscribe to RSS Feed
- Mark Topic as New
- Mark Topic as Read
- Float this Topic for Current User
- Bookmark
- Subscribe
- Mute
- Printer Friendly Page
- Mark as New
- Bookmark
- Subscribe
- Mute
- Subscribe to RSS Feed
- Permalink
- Report Inappropriate Content
Simple Layout Issue in LineChart
Hi Friends,
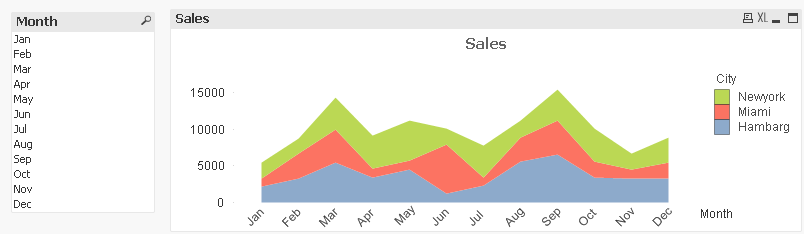
I am Having a Line chart in Plot Area style.
Dimensions are Month & City
Metrics are Sum of Sales
Here is the Output I am getting
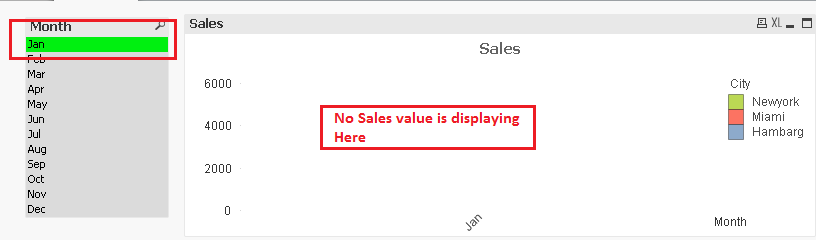
My Question is when we select any one Dimension(Month) this chart area will get disappear
In the following Image
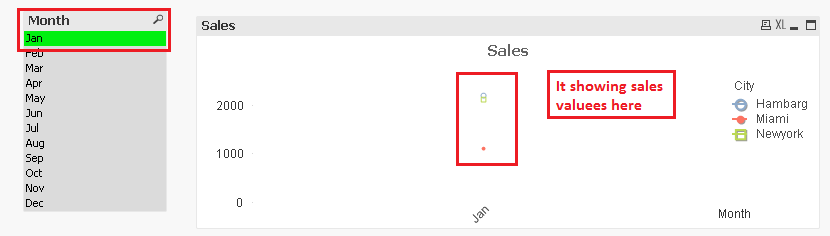
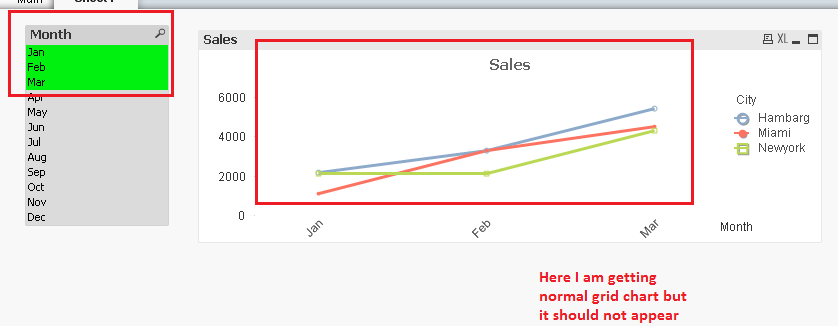
so I have created another line chart which is in normal grid. so when ever we select a single dimension(Month). Area chart get disappear and normal grid chart will be appear
In the following Image
I have used GetFieldSelections function to get this
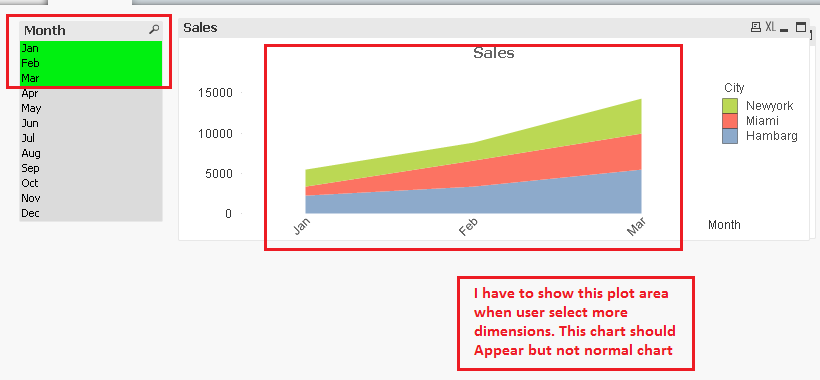
But here the problem is whenever user select more than 1 dimension(Months). I am getting normal grid chart.
My requirement is to get Plot Area Chart and disappear normal grid chart. just like in the following Images

I want following chart to be appear when user select more dimensions
I have used a GetFieldSelections function in Layout
Could any one of you guys can help me in resolving Issue
Here you can find sample qvw and related data
Thank you,
Satya
- Mark as New
- Bookmark
- Subscribe
- Mute
- Subscribe to RSS Feed
- Permalink
- Report Inappropriate Content
Hi,
I think, The plot are will show between the value. (start and End value)
if it is Single Selected value(e.g Jan only), there is no end value. That's why, we can't see the Plot Area.
It doesn't mean, the chart are will disappear.
If we select more than one value in List Box, There are two value (so, the plot are will display).
You can check this, Like Select Single value in Month and Enable the Value On Data Point in the Expression Tab.
- Mark as New
- Bookmark
- Subscribe
- Mute
- Subscribe to RSS Feed
- Permalink
- Report Inappropriate Content
Hi Periasamy,
Thank you for reply. I agree with you. Plot Area will disappear if it is single value that's why we have created one more chart which displays line with symbol when we select only one month here is the Image

but when we select two months following chart is displaying
but i want following chart to be displayed 
could you plz check Layout of both the charts you may get some Idea
Thank you,
Satya Paleti
- Mark as New
- Bookmark
- Subscribe
- Mute
- Subscribe to RSS Feed
- Permalink
- Report Inappropriate Content
Hi,
Try to Change the Conditional Layout Expression. Check the Attachment.
- Mark as New
- Bookmark
- Subscribe
- Mute
- Subscribe to RSS Feed
- Permalink
- Report Inappropriate Content
could you plz forward to satyapaleti@gmail.com I didn't find attachment
- Mark as New
- Bookmark
- Subscribe
- Mute
- Subscribe to RSS Feed
- Permalink
- Report Inappropriate Content
Hi satya,
Sorry for my 1st post reply.. i didn't check the hidden chart.
Is the attachment not showing? For you?
- Mark as New
- Bookmark
- Subscribe
- Mute
- Subscribe to RSS Feed
- Permalink
- Report Inappropriate Content
Can I ask why you are using two separate charts?
Andy
- Mark as New
- Bookmark
- Subscribe
- Mute
- Subscribe to RSS Feed
- Permalink
- Report Inappropriate Content
No but i Received mail thank you dear