Unlock a world of possibilities! Login now and discover the exclusive benefits awaiting you.
- Qlik Community
- :
- All Forums
- :
- QlikView App Dev
- :
- Re: Slider Help
- Subscribe to RSS Feed
- Mark Topic as New
- Mark Topic as Read
- Float this Topic for Current User
- Bookmark
- Subscribe
- Mute
- Printer Friendly Page
- Mark as New
- Bookmark
- Subscribe
- Mute
- Subscribe to RSS Feed
- Permalink
- Report Inappropriate Content
Slider Help
Hi
I am new to QV and for the life of me cannot work out how to link my slider to the qv table.
I would like the slider to show relative % and the table to reflect which relative percentages to show in the table.
Table looks like below
| department | Relative % |
|---|---|
| gas | 50.00 |
| elec | 30.00 |
slider will be on relative % 1-100% scale. I have a variable set up which reflects wha has been selected in the slider.
Please can someone help me with the formula for the table and also where to assign it - ie dimension or expression.
Thanks
Jo
- Tags:
- new_to_qlikview
- Mark as New
- Bookmark
- Subscribe
- Mute
- Subscribe to RSS Feed
- Permalink
- Report Inappropriate Content
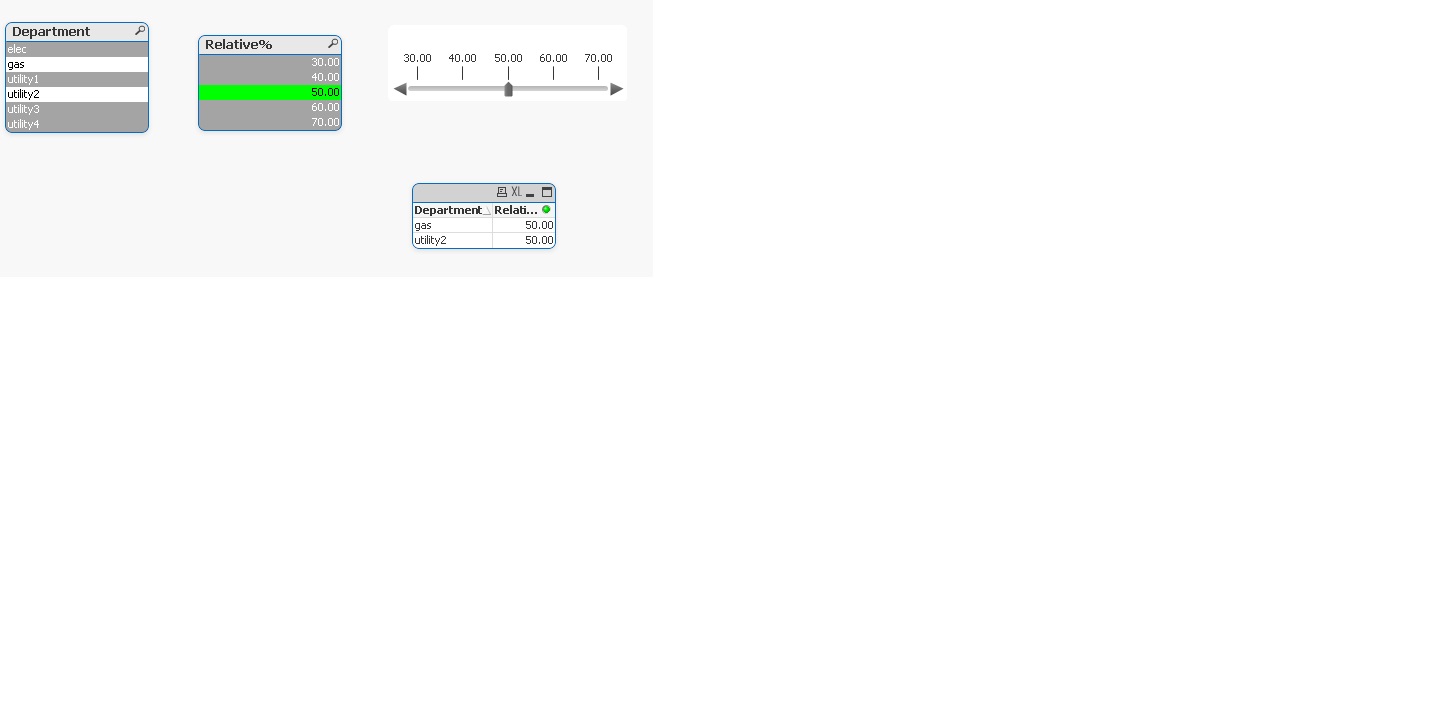
Joanne:
is this is what you are trying to do
- Mark as New
- Bookmark
- Subscribe
- Mute
- Subscribe to RSS Feed
- Permalink
- Report Inappropriate Content
Hi Jo,
Right click -> New Sheet Object -> Slider/Calendar Object.
You need to assign the field in the General -> Data -> Field -> Relative(Data base column which you want to represent).
You can adjust the scaling in Presentation Tab.
Thanks
Sai Krishna
- Mark as New
- Bookmark
- Subscribe
- Mute
- Subscribe to RSS Feed
- Permalink
- Report Inappropriate Content
Hi,
Please find attached file for solution.
Regards,
Jagan.
- Mark as New
- Bookmark
- Subscribe
- Mute
- Subscribe to RSS Feed
- Permalink
- Report Inappropriate Content
Hi Joanne,
You mentioned that you have defined a variable!
Then you want to link it to your chart
What I will do in this case is to right click on the chart > Properies > Expression > Add new expression (click ADD) > then enter Relative * (1+ VARIABLE NAME)
Click OK
Then give the new expression a name LABEL
You will see new column added to the straight table with the label you've given
then right click on the blank space on the page, select Slider > in the General tab > check the radio button for variable and select your variable name (if not showing by default) > down the page set minimum value & maximum value > select the Number tab and specify % > click OK and Apply
Let me know if that helps.
Regards,
Gabriel