Unlock a world of possibilities! Login now and discover the exclusive benefits awaiting you.
- Qlik Community
- :
- All Forums
- :
- QlikView App Dev
- :
- Re: Split en sum duration
- Subscribe to RSS Feed
- Mark Topic as New
- Mark Topic as Read
- Float this Topic for Current User
- Bookmark
- Subscribe
- Mute
- Printer Friendly Page
- Mark as New
- Bookmark
- Subscribe
- Mute
- Subscribe to RSS Feed
- Permalink
- Report Inappropriate Content
Split en sum duration
Hi all,
I have a text file that as follows: cardnumber, building/floor, time in, time out, duration.
example: c001, Crown/firstfloor, 31/07/18 11:59:58 PM, 01/08/18 12:01:57 AM, 00:01:59
Qlik is new for me so I hope somebody can give me a step in the right direction.
How can I split building/floor and sum duration (duration cardnumber...floor)
Anyone help on this?
Thanks,
Gert
Accepted Solutions
- Mark as New
- Bookmark
- Subscribe
- Mute
- Subscribe to RSS Feed
- Permalink
- Report Inappropriate Content
Hi Gert,
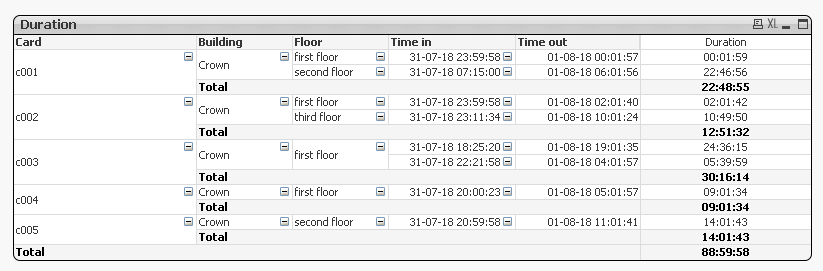
Take a look at the attached file. Splitting of Building/floor is done in the code, whereas the calculation of duration is done in the chart.
Output as below.
- Mark as New
- Bookmark
- Subscribe
- Mute
- Subscribe to RSS Feed
- Permalink
- Report Inappropriate Content
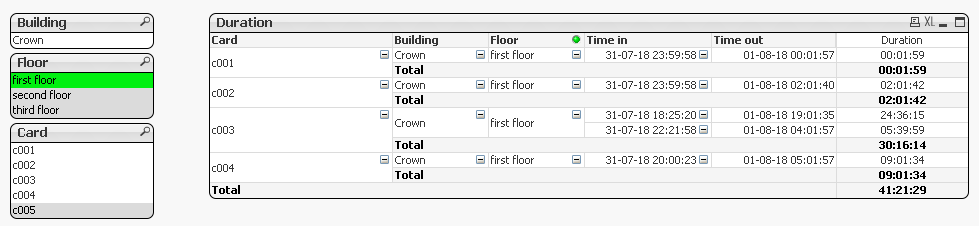
Depending on how you want to present the data you could also change the order of dimensions and/or add list boxes as I have done below.
- Mark as New
- Bookmark
- Subscribe
- Mute
- Subscribe to RSS Feed
- Permalink
- Report Inappropriate Content
If you can share image of data file and expected result?
- Mark as New
- Bookmark
- Subscribe
- Mute
- Subscribe to RSS Feed
- Permalink
- Report Inappropriate Content
Anil,
Some background information, A customer can use a room and have to pay the total time he makes use of the room. The customer makes use of a smartcard to get in and out the room.
I want to know how much time the customer spend in the building and in a room. Occupancy rate per room etc.
I'va added an image of the datafile.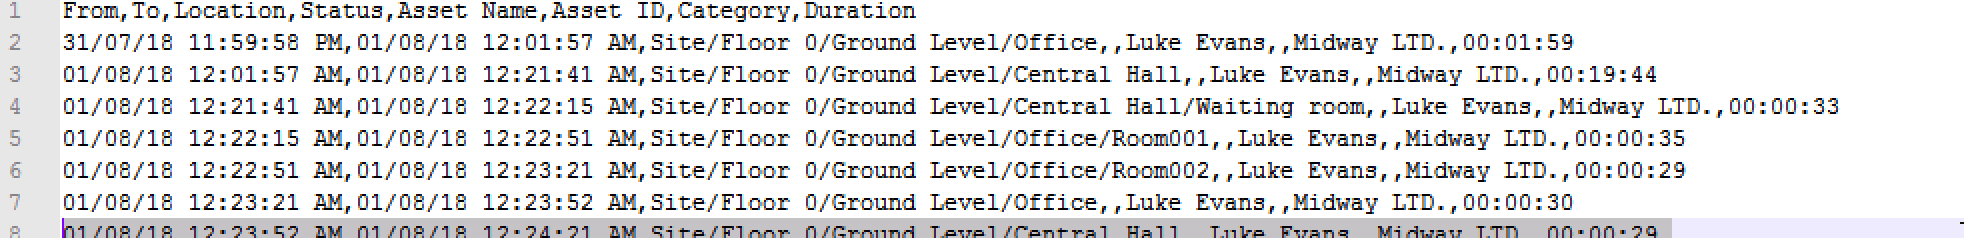
- Mark as New
- Bookmark
- Subscribe
- Mute
- Subscribe to RSS Feed
- Permalink
- Report Inappropriate Content
To split building/floor, you can use the SubField function in script. See the script in the attached file. You cannot do this in the original load, as you cannot perform calculations on fields that haven't been loaded in yet. That's why you have to load in your data first, name that table, then perform a resident load that includes your calculations, and then drop the original table as you no longer need it.
To sum duration and group it by cardnumber/floor/building/anything (I think this is what you mean) you have 2 options. You can either calculate and group the duration in script and create a separate table in the data model (dropping the original ungrouped data afterwards if possible), or you can do it in front end, probably in a straight table.
I only used the second option in the attached file as it's a lot simpler and leaves your data ungrouped for further analysis. Simply add a chart, select Straight table in chart type, add cardnumber/building/floor as dimension (depending on how you want the data to be grouped), then add Sum(duration) as the expression. Keep pressing next until you get to number format, and switch the number format for the expression to Time. Click finish and you should have what you want.
Hope this helps, if not let me know 
- Mark as New
- Bookmark
- Subscribe
- Mute
- Subscribe to RSS Feed
- Permalink
- Report Inappropriate Content
Hi Gert,
Take a look at the attached file. Splitting of Building/floor is done in the code, whereas the calculation of duration is done in the chart.
Output as below.
- Mark as New
- Bookmark
- Subscribe
- Mute
- Subscribe to RSS Feed
- Permalink
- Report Inappropriate Content
Hi Anders,
Yes, this is what I try to accomplish. With this is it also possible to filter total duration for example on 'first floor' ?
- Mark as New
- Bookmark
- Subscribe
- Mute
- Subscribe to RSS Feed
- Permalink
- Report Inappropriate Content
As Jens mentioned you can do subfield() to split building/floor as
Tab1:
LOAD Keyfield,
Subfield([Building/floor], '/',1) AS Building
Subfield([Building/floor], '/',2) AS Floor
Interval(duration, 'ss') as Seconds
From tablename;
LEFT JOIN(Tab1)
LOAD Keyfield
Sum(Seconds) as Sum_Duration
Resident Tab1
Group By Keyfield;
--> To convert the Sum_Duration to actual time duration you can try like
Interval(Sum_Duration/(24*60*60), 'hh:mm:ss') as TimeDuration
- Mark as New
- Bookmark
- Subscribe
- Mute
- Subscribe to RSS Feed
- Permalink
- Report Inappropriate Content
A pivot table splits the data in order of dimensions. So you'd be able to collapse the floor and building dimensions in this table to show total duration per card number, but not per building or floor. To accomplish that you could either build multiple tables or, probably better yet, use a Cyclic group to be able to swap between table layouts easily without having to rebuild the table.
If you still want to be able to split the data on every level just in a customisable order, but in 1 table, you could do like I did in the attached file and create 3 cyclic groups, and add all 3 dimensions to each (settings > document properties > groups), then use all 3 as dimensions in the pivot table. You can then swap every dimension as you wish using the circular arrows in the dimension columns.
- Mark as New
- Bookmark
- Subscribe
- Mute
- Subscribe to RSS Feed
- Permalink
- Report Inappropriate Content
Depending on how you want to present the data you could also change the order of dimensions and/or add list boxes as I have done below.