Unlock a world of possibilities! Login now and discover the exclusive benefits awaiting you.
- Qlik Community
- :
- All Forums
- :
- QlikView App Dev
- :
- Stacked Chart - Values and Labels
- Subscribe to RSS Feed
- Mark Topic as New
- Mark Topic as Read
- Float this Topic for Current User
- Bookmark
- Subscribe
- Mute
- Printer Friendly Page
- Mark as New
- Bookmark
- Subscribe
- Mute
- Subscribe to RSS Feed
- Permalink
- Report Inappropriate Content
Stacked Chart - Values and Labels
Hi,
My query is regarding stacked charts. My requirement is to create a stacked chart where the label is not equal to the value.
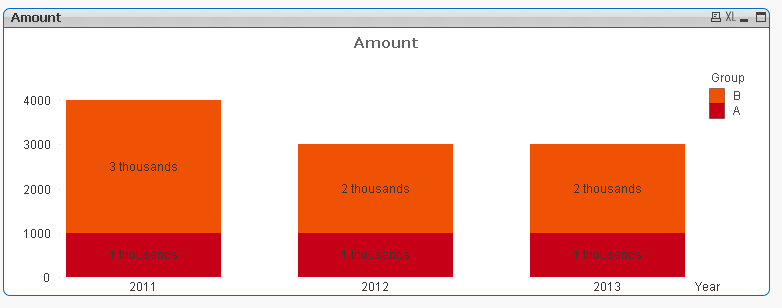
Consider an example where there is a stacked chart. X-axis (dimension) is Year (2011, 2012, 2013 and 2013) and Y-axis is the stacked data for total number of flights for various airlines companies (American Airlines, Air Asia, Qataar Airways) i.e gives the count. Now, for Air Asia in particular if the # of flights is 3000 then the label on the bar should read 'Three Thousand'. Is there a way to have the labels distinct from the values in stacked charts?
Thanks in advance!
Accepted Solutions
- Mark as New
- Bookmark
- Subscribe
- Mute
- Subscribe to RSS Feed
- Permalink
- Report Inappropriate Content
Yes you can use a dual function in the expression, Dual(Text,Value) and check the values on datapoints and maybe the plot values inside segments in the presentation tab.
For example (you may have to change the text representation to your needs)
Dual(Sum(Amount)/pow(10,(len(Sum(Amount))-1))&' '&pick((len(Sum(Amount))-1),'(1)','(10)','thousands')
,Sum(Amount))
See also example attached
- Mark as New
- Bookmark
- Subscribe
- Mute
- Subscribe to RSS Feed
- Permalink
- Report Inappropriate Content
Thank you for the response! This solution worked perfectly for me!
- Mark as New
- Bookmark
- Subscribe
- Mute
- Subscribe to RSS Feed
- Permalink
- Report Inappropriate Content
Thanks! Saved a lot of time. One addition: on the 'Number' tab, set the number representation to 'Expression default' otherwise it will not show the text...
HP