Unlock a world of possibilities! Login now and discover the exclusive benefits awaiting you.
- Qlik Community
- :
- All Forums
- :
- QlikView App Dev
- :
- Stacked bar chart with both negative and positive ...
- Subscribe to RSS Feed
- Mark Topic as New
- Mark Topic as Read
- Float this Topic for Current User
- Bookmark
- Subscribe
- Mute
- Printer Friendly Page
- Mark as New
- Bookmark
- Subscribe
- Mute
- Subscribe to RSS Feed
- Permalink
- Report Inappropriate Content
Stacked bar chart with both negative and positive values
Hi,
I have created a sales pipeline where I also want to incorporate the customers where we have lost/decreased revenue. I have three expressions, NewSales, Pending and Lost.
The numbers in the lost expression are negative.
I want the bar to show the sum of the three expression. In January 2016, the new sales where 3.92m, pending was 0.1m and lost was -0.96. The sum of these three are 3.06 and I want the bar to show this number.
How do I achieve this? Now it show 4.02 because the chart doesn't start at zero.

- Tags:
- new_to_qlikview
- Mark as New
- Bookmark
- Subscribe
- Mute
- Subscribe to RSS Feed
- Permalink
- Report Inappropriate Content
Maybe just use one expression:
=Rangesum( Sum(NewSales), Sum(Pending), Sum(Lost) )
[or whatever your three expressions look like, replace the three sums with your expressions]
- Mark as New
- Bookmark
- Subscribe
- Mute
- Subscribe to RSS Feed
- Permalink
- Report Inappropriate Content
Hi Sandra,
For your solution RangeSum is a good and straight way to do it as the Y axis will then correspond to the sum (Eg: 3.06)
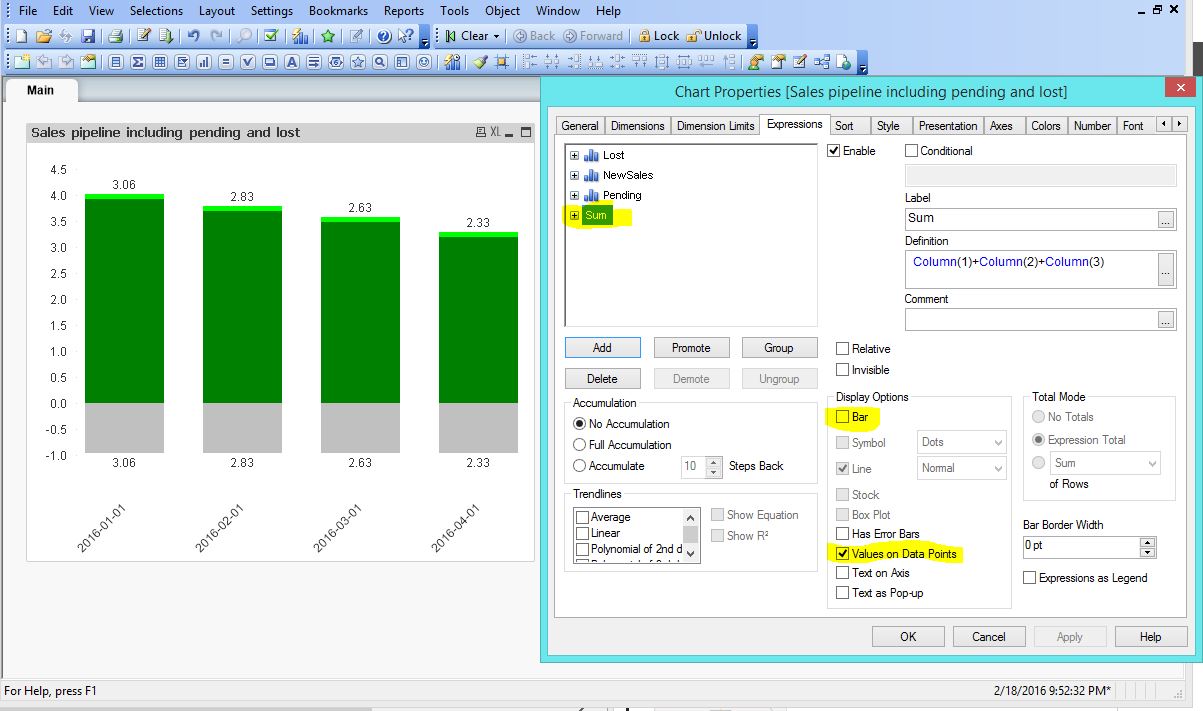
However I think you want to preserve the different color code for each measure and want the Loss to be shown below 0 right? If that is a strict requirement, you can do one hack. See the attached screen. Here, in the expressions tab, I have added a 4th expression which is simply the sum of first 3 and I am not showing it as 'Bar' but just 'Values on Data Points'.
There are 2 issues here though:
1) That total on top of each bar (3.06, 2.83 etc) will be misleading here because the bar length still corresponds to Y axis (eg: 4.02, 3.79 etc)
2) At the x axis above the dates, this same value label is repeated. There could be a way to hide it. One trick (and not very graceful) would be to place a long thin white text box on top.
- Mark as New
- Bookmark
- Subscribe
- Mute
- Subscribe to RSS Feed
- Permalink
- Report Inappropriate Content
see the attachment.. it might help you..
- Mark as New
- Bookmark
- Subscribe
- Mute
- Subscribe to RSS Feed
- Permalink
- Report Inappropriate Content
If you have 3 expressions, either use wuehl's suggestion, or add this expression, clear the bar option and set the "Values on Data Points" for this expression:
=RangeSum(Column(1), Column(2), Column(3))