Unlock a world of possibilities! Login now and discover the exclusive benefits awaiting you.
- Qlik Community
- :
- All Forums
- :
- QlikView App Dev
- :
- Re: Straight Table Concatenated Text
- Subscribe to RSS Feed
- Mark Topic as New
- Mark Topic as Read
- Float this Topic for Current User
- Bookmark
- Subscribe
- Mute
- Printer Friendly Page
- Mark as New
- Bookmark
- Subscribe
- Mute
- Subscribe to RSS Feed
- Permalink
- Report Inappropriate Content
Straight Table Concatenated Text
Hello,
Looking for some help on creating a similar view to Excel. The user is looking for me to concatenate all Possible perils attributed to a loss. If loss # 1-10 is shown on a table, they want to see the perils associated with each similar to the picture below:
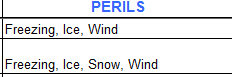
Is this possible with some sort of pick function? Just not sure how to properly set this up in a pivot table or a straight table.
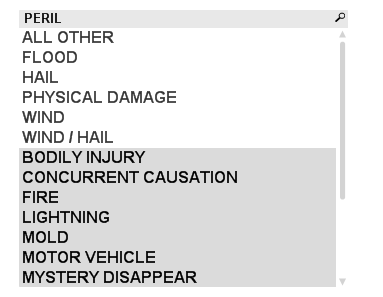
Here are the full list of perils:
Thank you,
Justin
Accepted Solutions
- Mark as New
- Bookmark
- Subscribe
- Mute
- Subscribe to RSS Feed
- Permalink
- Report Inappropriate Content
I am not sure what you really want, but the concat function migth work if you select the perils which apply
=concat(PERIL,',')
- Mark as New
- Bookmark
- Subscribe
- Mute
- Subscribe to RSS Feed
- Permalink
- Report Inappropriate Content
Could you post full data set?
(and not the screen shots)
- Mark as New
- Bookmark
- Subscribe
- Mute
- Subscribe to RSS Feed
- Permalink
- Report Inappropriate Content
I am not sure what you really want, but the concat function migth work if you select the perils which apply
=concat(PERIL,',')
- Mark as New
- Bookmark
- Subscribe
- Mute
- Subscribe to RSS Feed
- Permalink
- Report Inappropriate Content
Rudolf,
Thanks for the help, I had forgot the comma, and also distinct before Peril. Many thanks for sparking the correct answer. Is there a way to limit how many perils show up? Possibly in highest loss order?
Thanks,
Justin
- Mark as New
- Bookmark
- Subscribe
- Mute
- Subscribe to RSS Feed
- Permalink
- Report Inappropriate Content
Try
=CONCAT(IF(aggr(Rank(sum(Loss)),Peril)<=3,Peril),',')
Gives first 3 with the highest values
Feeling hungry:
- Mark as New
- Bookmark
- Subscribe
- Mute
- Subscribe to RSS Feed
- Permalink
- Report Inappropriate Content
as far as i know it is not possible to Limit the numers.
only if you select only 3 fields, These fields will be concatenated
sorting can be done using the sort tab
what might work is the function findoneof (Returns the number of Position)
findoneof(concat(PERIL,','),',',3) Returns the Position of the third sign ","
then
left(concat(PERIL,','),findoneof(concat(PERIL,','),',',3)-1)
I didnot try it, maybe you have to adjust a Little but the way migth work
- Mark as New
- Bookmark
- Subscribe
- Mute
- Subscribe to RSS Feed
- Permalink
- Report Inappropriate Content
Robert,
The expression last given that is CONCAT(IF(aggr(Rank(sum([CAT AY INC LOSS])),PERIL)<=3,PERIL),',') shows the following result:
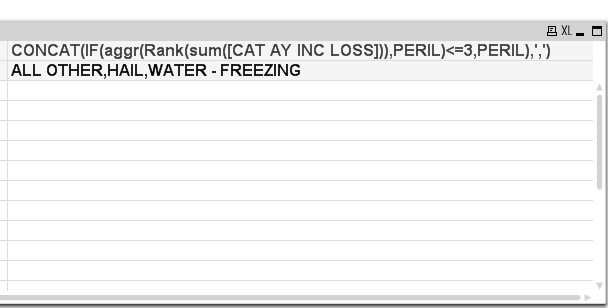
If you select one of the dimension values in this case [CAT CODE], it will show the top 3. Is there a way to get this to show without any selections, ie to have the table fully filled out by the top 3?
Thanks again,
Justin
- Mark as New
- Bookmark
- Subscribe
- Mute
- Subscribe to RSS Feed
- Permalink
- Report Inappropriate Content
Robert,
The missing manual link is fabulous as well, great work and thank you.