Unlock a world of possibilities! Login now and discover the exclusive benefits awaiting you.
- Qlik Community
- :
- All Forums
- :
- QlikView App Dev
- :
- Re: Substraction in Straight Table
- Subscribe to RSS Feed
- Mark Topic as New
- Mark Topic as Read
- Float this Topic for Current User
- Bookmark
- Subscribe
- Mute
- Printer Friendly Page
- Mark as New
- Bookmark
- Subscribe
- Mute
- Subscribe to RSS Feed
- Permalink
- Report Inappropriate Content
Substraction in Straight Table
Hello together,
I would like to do the following:
I´ve two expressions:
sum({$<FYear = {$(vChooseYear1)}, OrderPhase_Desc = {$(vOrderPhaseDesc)}>}NettAmount$(vCurrency))
and
sum({$<FYear = {$(vChooseYear2)}, FDay = {'<=$(vFDay)'}, OrderPhase_Desc = {$(vOrderPhaseDesc)}>}NettAmount$(vCurrency))
Now I would like to calculate the difference between these two expressions. Up to now I used:
Column(5) - column(6)
But as I´ve several expression in my chart and I also would like to use the conditional display Column 5 - Column 6 will not work does not work because if the condition excludes an expression before then Qlik View doesn´t recognize this which means that another expression is then column 5 and 6 and I get incorrect values.
Is there any possibility to e.g. give a name to an expression and then calculate with it or anything else?
Many thanks for your help.
Best regards,
Carolin
Accepted Solutions
- Mark as New
- Bookmark
- Subscribe
- Mute
- Subscribe to RSS Feed
- Permalink
- Report Inappropriate Content
I see Carolin,
then you better use the 'variable' solution. Variables are calculated at once only if you define them with a leading '=' sign. Without the '=' they are calculated in the expression inside the dollar sign expansion.
Please try.
Burkhard
- Mark as New
- Bookmark
- Subscribe
- Mute
- Subscribe to RSS Feed
- Permalink
- Report Inappropriate Content
You can put the original expressions in variables and use the variables in your chart expressions instead:
Variable vExp1: sum({$<FYear = {$(vChooseYear1)}, OrderPhase_Desc = {$(vOrderPhaseDesc)}>}NettAmount$(vCurrency))
Variable vExp2: sum({$<FYear = {$(vChooseYear2)}, FDay = {'<=$(vFDay)'}, OrderPhase_Desc = {$(vOrderPhaseDesc)}>}NettAmount$(vCurrency))
Expression for Column 5: $(vExp1)
Expression for Column 6: $(vExp2)
Expression for Column 7: $(vExp1) - $(vExp2)
talk is cheap, supply exceeds demand
- Mark as New
- Bookmark
- Subscribe
- Mute
- Subscribe to RSS Feed
- Permalink
- Report Inappropriate Content
This is defintely a good idea and will help me for the futur to create charts much faster.
There is just one problem that you can see from my screenshot:
I´m using a cyclic group in that straight table as well. I´m not sure how I have to change my formula 
- Mark as New
- Bookmark
- Subscribe
- Mute
- Subscribe to RSS Feed
- Permalink
- Report Inappropriate Content
Can you post an example document that demonstrates the problem? This document may help creating such a document: Preparing examples for Upload - Reduction and Data Scrambling
talk is cheap, supply exceeds demand
- Mark as New
- Bookmark
- Subscribe
- Mute
- Subscribe to RSS Feed
- Permalink
- Report Inappropriate Content
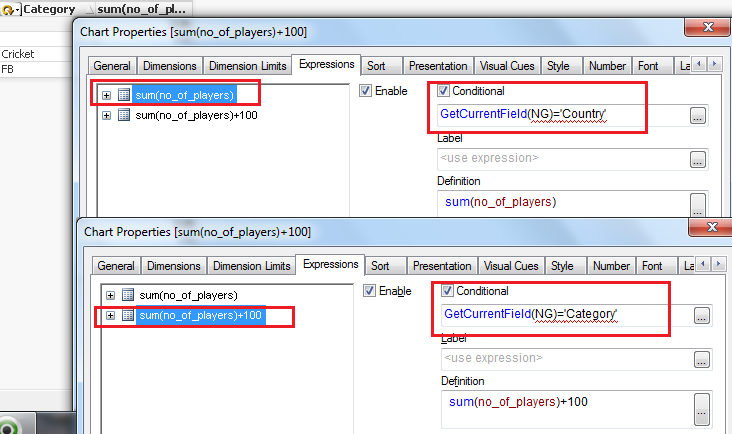
If you are looking for using multiple expressions based on the selection of Cycle Group values then you can use Chart Expression Conditional option.
Example below:
I've a group named as NG having two fields Country and Category.
Whenever I select Country from the Cyclic Group I want the sum(no_of_players) to be displayed
Whenever I select Category from the Cyclic Group I want the sum(no_of_players)+100 to be displayed
- Mark as New
- Bookmark
- Subscribe
- Mute
- Subscribe to RSS Feed
- Permalink
- Report Inappropriate Content
Hi Carolin,
why not use the labels of your expressions for the subtraction?
See the picture below:
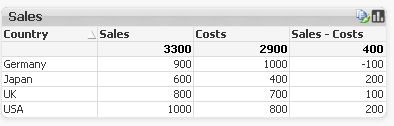
This works fine.
Regards
Burkhard
- Mark as New
- Bookmark
- Subscribe
- Mute
- Subscribe to RSS Feed
- Permalink
- Report Inappropriate Content
Hi,
If I could use lables for my calculation then this would be perfect. I use the following formula to create my lables:
Label 1 for column 5
='YTD $(vChooseYear1)'
Label 2 for column 6
='YTD $(vChooseYear2)'
I tried:
='YTD $(vChooseYear1)' - 'YTD $(vChooseYear2)'
But this doesn´t work.
Using variables for to calculate the sums Gysbert suggested is actually also a good idea. The problem is just that as soon as you insert the variable as formula it gets automatically calculated immediately. And that means that the variable is automatically the total, e.g. 500,000 as from my screenshot above. If I then use in the chart as expression =Variable xy then it shows always the 500,000. Maybe there is an option to delay the calculation of the variable until it is used in the expression of the chart?
Best regards
Carolin
- Mark as New
- Bookmark
- Subscribe
- Mute
- Subscribe to RSS Feed
- Permalink
- Report Inappropriate Content
I see Carolin,
then you better use the 'variable' solution. Variables are calculated at once only if you define them with a leading '=' sign. Without the '=' they are calculated in the expression inside the dollar sign expansion.
Please try.
Burkhard
- Mark as New
- Bookmark
- Subscribe
- Mute
- Subscribe to RSS Feed
- Permalink
- Report Inappropriate Content
Dear Burkhard,
Thank you for helping me with the solution. I then changed my formula in the expression to:
$(=vCalcYTDYear1)
And then it worked well. Thank you Gysbert for the idea. I will use the variable now as "formula generator".
Best regards
Carolin