Unlock a world of possibilities! Login now and discover the exclusive benefits awaiting you.
- Qlik Community
- :
- All Forums
- :
- QlikView App Dev
- :
- Sum and Multiply of fields (Aggr???)
- Subscribe to RSS Feed
- Mark Topic as New
- Mark Topic as Read
- Float this Topic for Current User
- Bookmark
- Subscribe
- Mute
- Printer Friendly Page
- Mark as New
- Bookmark
- Subscribe
- Mute
- Subscribe to RSS Feed
- Permalink
- Report Inappropriate Content
Sum and Multiply of fields (Aggr???)
Hey,
Im having this table for examle:
| Work Order | Month | cost | Qty | Ext Cost |
| P160000 | Jan-16 | 50 | 20 | 1000 |
| P160001 | Jan-16 | 10 | 100 | 1000 |
| P160002 | Feb-16 | 70 | 20 | 1400 |
| P160003 | Feb-16 | 50 | 5 | 250 |
| P160004 | Feb-16 | 60 | 40 | 2400 |
| P160005 | Mar-16 | 10 | 10 | 100 |
| P160006 | Mar-16 | 30 | 20 | 600 |
| P160007 | Mar-16 | 15 | 5 | 75 |
| P160008 | Mar-16 | 20 | 4 | 80 |
and im trying to get in a chart the Sum of Ext Cost per each month.
ext cost = cost*qty
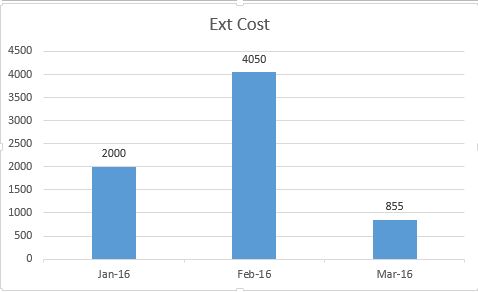
while what im trying to get is somthing like that : Sum(cost*Qty) per month and to get that final chart (not in Pivot, cuz i want to use it in graph) -
| Month | Ext Cost |
| Jan-16 | 2000 |
| Feb-16 | 4050 |
| Mar-16 | 855 |
or like this:
i know i probably need to use Agrr but dont know how/
please help/
tnx,
Oren
- Mark as New
- Bookmark
- Subscribe
- Mute
- Subscribe to RSS Feed
- Permalink
- Report Inappropriate Content
Hi Oren,
You don't need aggr for this, Qlik will just aggregate it for you
Please remember to mark this as helpful or the correct answer if I have helped you or answered your question.
This will help users identify the answers should they come across this thread in the future.
- Mark as New
- Bookmark
- Subscribe
- Mute
- Subscribe to RSS Feed
- Permalink
- Report Inappropriate Content
Hi adam,
its dont worked good at my origin data.
what i aventualy tried and probably worked good was:
=sum(Aggr(Cost*Qty,WorkOrder))