Unlock a world of possibilities! Login now and discover the exclusive benefits awaiting you.
- Qlik Community
- :
- All Forums
- :
- QlikView App Dev
- :
- Re: Sum largest values each year. Rank, Sum & Aggr...
- Subscribe to RSS Feed
- Mark Topic as New
- Mark Topic as Read
- Float this Topic for Current User
- Bookmark
- Subscribe
- Mute
- Printer Friendly Page
- Mark as New
- Bookmark
- Subscribe
- Mute
- Subscribe to RSS Feed
- Permalink
- Report Inappropriate Content
Sum largest values each year. Rank, Sum & Aggr?
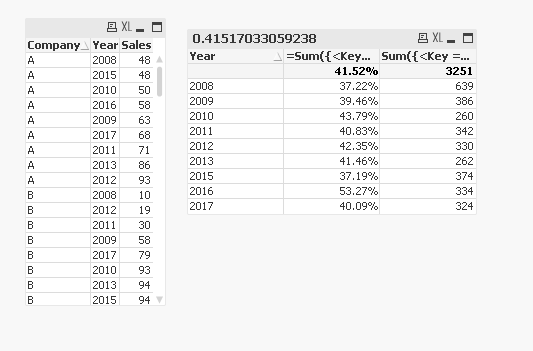
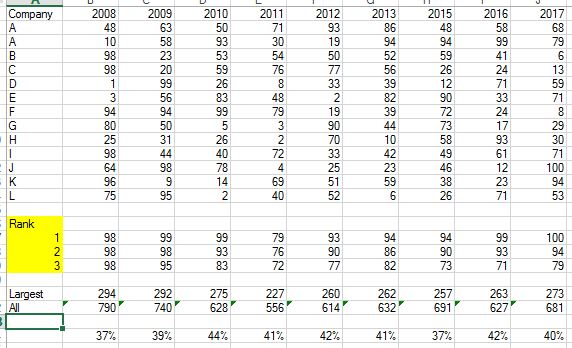
I'm trying to make a graph which shows the sum of the 3 largest values each year as a percentage of the sum of all values each year. I've tried to use rank, sum and aggr, but it does not work for me. Can someone guide me in the right direction by providing me with a link to a thread where this is discussed (I have not found one that's appropriate, but perhaps you will) or by helping me directly? Pleas find attached example of input data to QV.
Accepted Solutions
- Mark as New
- Bookmark
- Subscribe
- Mute
- Subscribe to RSS Feed
- Permalink
- Report Inappropriate Content
Try this
=Sum({<Key = {"=Aggr(Rank(Sum(Sales)), Year, Company) < 4"}>} Sales)/Sum(Sales)
Where Key is created in the script
Table:
CrossTable(Year, Sales)
LOAD Company,
[2008],
[2009],
[2010],
[2011],
[2012],
[2013],
[2015],
[2016],
[2017]
FROM
[..\..\Downloads\QVRANK.xlsx]
(ooxml, embedded labels, table is QV);
FinalTable:
LOAD *,
Company&Year as Key
Resident Table;
DROP Table Table;
- Mark as New
- Bookmark
- Subscribe
- Mute
- Subscribe to RSS Feed
- Permalink
- Report Inappropriate Content
What would be the expected output based on the sample attached?
- Mark as New
- Bookmark
- Subscribe
- Mute
- Subscribe to RSS Feed
- Permalink
- Report Inappropriate Content
Also, do you have years in different columns or do you have an year field?
- Mark as New
- Bookmark
- Subscribe
- Mute
- Subscribe to RSS Feed
- Permalink
- Report Inappropriate Content
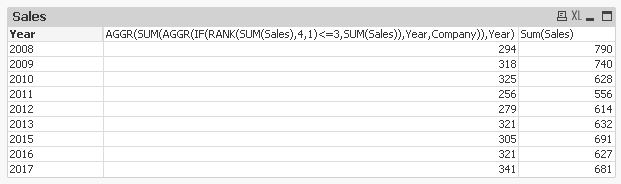
maybe you can check if this is correct -
- Mark as New
- Bookmark
- Subscribe
- Mute
- Subscribe to RSS Feed
- Permalink
- Report Inappropriate Content
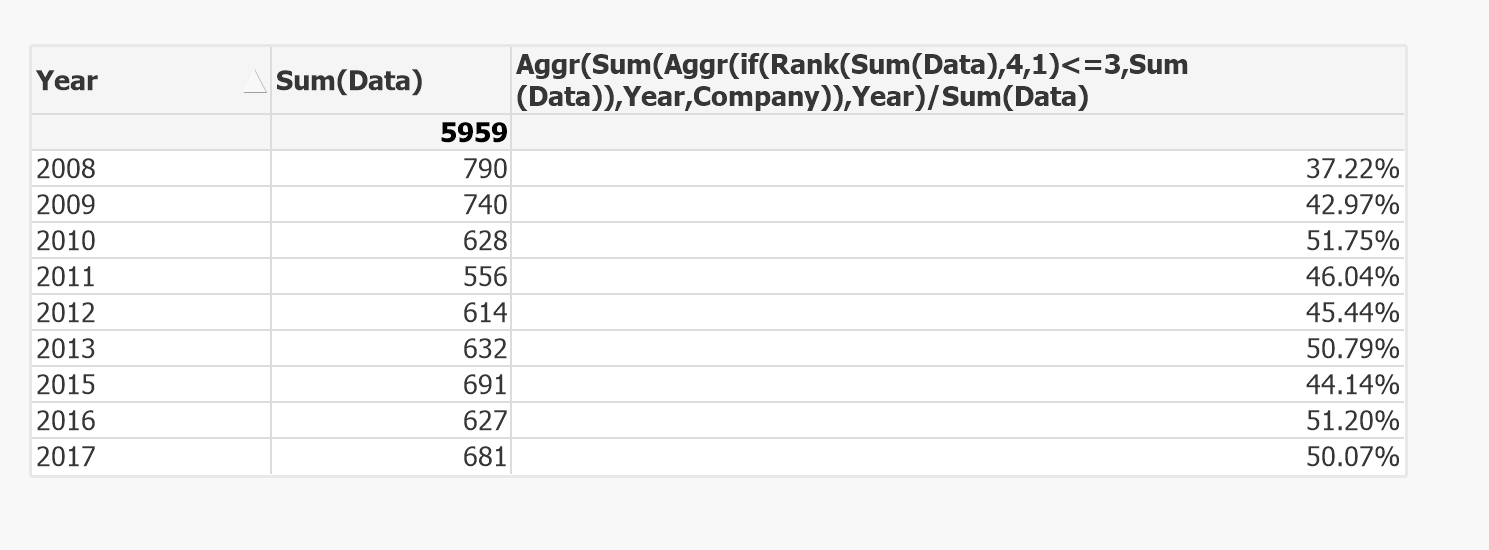
Almost. I have had this problem before. It seems as if the formula sums more values than the three biggest values... The first year is correct, but the second is not correct when I compare to my excel sheet.
- Mark as New
- Bookmark
- Subscribe
- Mute
- Subscribe to RSS Feed
- Permalink
- Report Inappropriate Content
Company A repeats twice, is this by mistake?
- Mark as New
- Bookmark
- Subscribe
- Mute
- Subscribe to RSS Feed
- Permalink
- Report Inappropriate Content
Try this
=Sum({<Key = {"=Aggr(Rank(Sum(Sales)), Year, Company) < 4"}>} Sales)/Sum(Sales)
Where Key is created in the script
Table:
CrossTable(Year, Sales)
LOAD Company,
[2008],
[2009],
[2010],
[2011],
[2012],
[2013],
[2015],
[2016],
[2017]
FROM
[..\..\Downloads\QVRANK.xlsx]
(ooxml, embedded labels, table is QV);
FinalTable:
LOAD *,
Company&Year as Key
Resident Table;
DROP Table Table;
- Mark as New
- Bookmark
- Subscribe
- Mute
- Subscribe to RSS Feed
- Permalink
- Report Inappropriate Content
The problem is only due to two rows for Company A, it has aggregated both values and that is why it is making into first three ranks after first row. First row addition rank is not making into first 3 show it is showing correct value. having two rows for Company A is right behavior or its a data issue?