Unlock a world of possibilities! Login now and discover the exclusive benefits awaiting you.
- Qlik Community
- :
- All Forums
- :
- QlikView App Dev
- :
- Sum of calculated expression from Chart in Text Bo...
- Subscribe to RSS Feed
- Mark Topic as New
- Mark Topic as Read
- Float this Topic for Current User
- Bookmark
- Subscribe
- Mute
- Printer Friendly Page
- Mark as New
- Bookmark
- Subscribe
- Mute
- Subscribe to RSS Feed
- Permalink
- Report Inappropriate Content
Sum of calculated expression from Chart in Text Box
Hi All,
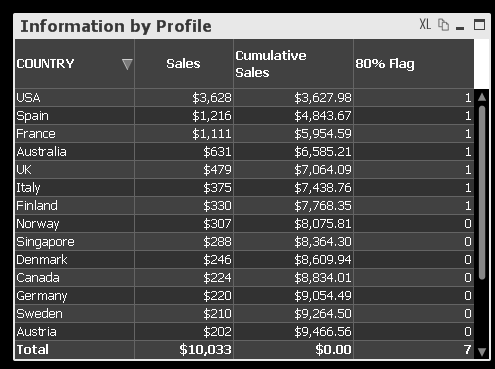
In the attached file, I need to get the Total of "80% Flag" (which is calculated in the table) in the Text Box(No. of Product Code with 80% Sales).
Could you please Help regarding the same?
The idea is if in anyway we can save the total in a variable and display that variable in the text box.
That variable should be updated on every change in selections.
Thanks in Advance
Rishabh
- Mark as New
- Bookmark
- Subscribe
- Mute
- Subscribe to RSS Feed
- Permalink
- Report Inappropriate Content
Check this out
- Mark as New
- Bookmark
- Subscribe
- Mute
- Subscribe to RSS Feed
- Permalink
- Report Inappropriate Content
Hi Sunny,
Thanks for the response but this still doesn't solve my problem. I am not able to get the value in the Text box.
- Mark as New
- Bookmark
- Subscribe
- Mute
- Subscribe to RSS Feed
- Permalink
- Report Inappropriate Content
Are you sure the value in the chart is correct, can you explain outside of QlikView how are you calculating your top 80%?
- Mark as New
- Bookmark
- Subscribe
- Mute
- Subscribe to RSS Feed
- Permalink
- Report Inappropriate Content
Hi stalwar1,
In the Excel file if you look for count of countries with 80% of sales.It is 8.
Also in the graph, if you keep only four columns: Country, sales, cumulative sales and 80% flag; it will show 7 which is 1 less than 8 because there is a less than condition in the graph.
Hence it is correct.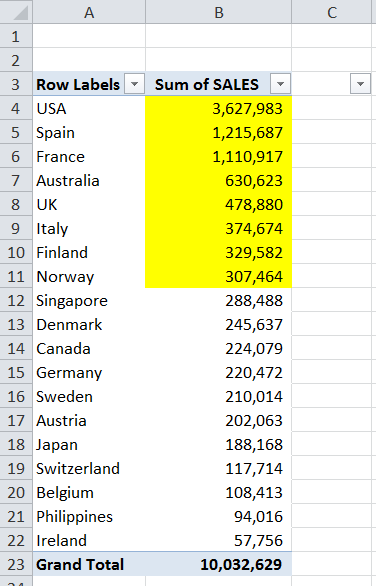
- Mark as New
- Bookmark
- Subscribe
- Mute
- Subscribe to RSS Feed
- Permalink
- Report Inappropriate Content
Hi Dear,
Did you manage to find any solution for your query? I have a similar requirement recently.
Many thanks,
Neelam