Unlock a world of possibilities! Login now and discover the exclusive benefits awaiting you.
- Qlik Community
- :
- All Forums
- :
- QlikView App Dev
- :
- Re: Sum product
- Subscribe to RSS Feed
- Mark Topic as New
- Mark Topic as Read
- Float this Topic for Current User
- Bookmark
- Subscribe
- Mute
- Printer Friendly Page
- Mark as New
- Bookmark
- Subscribe
- Mute
- Subscribe to RSS Feed
- Permalink
- Report Inappropriate Content
Sum product
Hi Team,
I am new to QLIK view, trying to develop my own dashboard. I am struck with Sum product formula, let me explain my case.
I have each market wise cost and volume, i want to know the overall Region cost. I have given below the sample data. In excel i will write formula as =sum product(Cost,Volume)/Total Volumes. please try to translate it to expression in QLIkview
| Region | Cost | Volumes |
| Dubai | 1,000.00 | 2000 |
| Israel | - | 0 |
| Northern Africa | 2,000.00 | 8000 |
| Southern Africa | 3,000.00 | 120000 |
| Other Africa | 4,000.00 | 20000 |
| Middle East & Africa Total | 3,053.33 | 150000 |
- « Previous Replies
- Next Replies »
Accepted Solutions
- Mark as New
- Bookmark
- Subscribe
- Mute
- Subscribe to RSS Feed
- Permalink
- Report Inappropriate Content
Not sure how you are getting 1530... I got 1639 when I did the above calculation is Excel... Do you agree with 1639?

- Mark as New
- Bookmark
- Subscribe
- Mute
- Subscribe to RSS Feed
- Permalink
- Report Inappropriate Content
Try this
Sum(Cost*Volume)/Sum(Volume)
- Mark as New
- Bookmark
- Subscribe
- Mute
- Subscribe to RSS Feed
- Permalink
- Report Inappropriate Content
Thanks stalwar1 However i just noticed that i have more items like this. For e.g assume the above given data is for Material cost, likewise i have 20 different cost like Lab our cost, selling cost, admin cost, marketing cost etc.
In the same format cost were appended one after another. In this case, if i need to get the same formula for one of the like items Selling cost, what i am i suppose to do.
- Mark as New
- Bookmark
- Subscribe
- Mute
- Subscribe to RSS Feed
- Permalink
- Report Inappropriate Content
I am not sure I follow... do you mind sharing the new data that you have?
- Mark as New
- Bookmark
- Subscribe
- Mute
- Subscribe to RSS Feed
- Permalink
- Report Inappropriate Content
For attaching, check here
- Mark as New
- Bookmark
- Subscribe
- Mute
- Subscribe to RSS Feed
- Permalink
- Report Inappropriate Content
Sunny,
I am trying to create a income statement for my product, how it will perform based on the product life cycle.
I want to report Per product cost, $ mils and in %, so created 3 different columns to report it, hence i have chosen cyclic view.
The problem with cyclic view is. It is summing up the total which will work out for $ mils, just sum of all region. However for per product cost, we need to use the sum product of respective line items (for eg. Admin exp) totals of all market and the volumes of respective market divided by overall volume. This is where i am struck.
I am happy if i can get this in KPI itself, so that i will remove the partial sum in my pivot. I have attached my sample data and QLIK view dashboard and dummy Inc statement.
Let me know if anybody can help me.
Regards
Ramesh
- Mark as New
- Bookmark
- Subscribe
- Mute
- Subscribe to RSS Feed
- Permalink
- Report Inappropriate Content
So, based on the sample data that you have attached, I guess you are having issue when Per Unit is selected, right? Is the problem here?
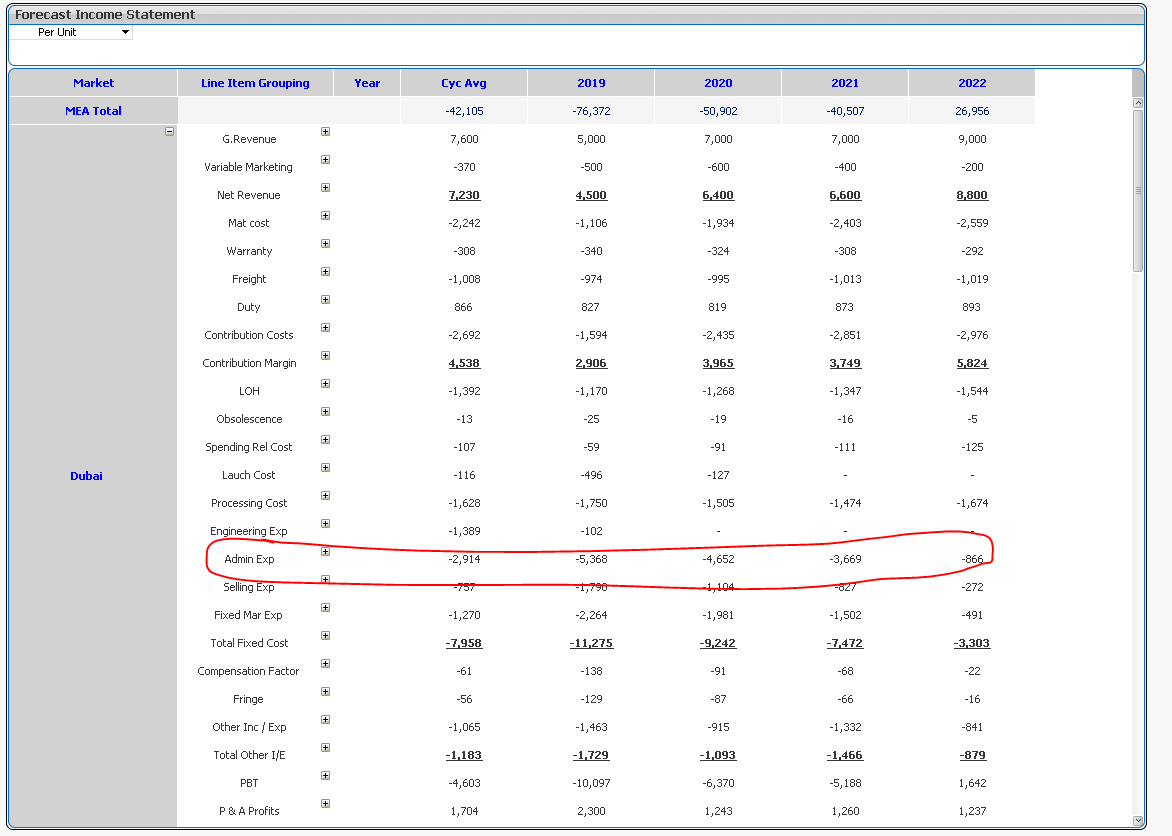
What is the number you expect to see here?
- Mark as New
- Bookmark
- Subscribe
- Mute
- Subscribe to RSS Feed
- Permalink
- Report Inappropriate Content
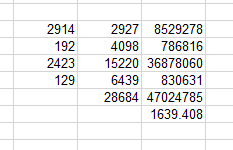
For example, at the top MEA total (Cycle average) i expected to see is 1530 which is
cyc avg - sum product (Dubai + North Africa + South Africa + Other Africa : Volume(Dubai+N.Africa+ S.Africa+ O.Africa) / Total Cyc avg volume
In numbers = sumproduct(2914+192+2423+129 : 2927+4098+15220+6439)/28683 = 1530
Similarly, each year should work in the same logic, when each item in the left is selected. When nothing selected, it should consider as Automotive PBT as selected and fetch the results of "Automotive PBT" as final number.
- Mark as New
- Bookmark
- Subscribe
- Mute
- Subscribe to RSS Feed
- Permalink
- Report Inappropriate Content
Not sure how you are getting 1530... I got 1639 when I did the above calculation is Excel... Do you agree with 1639?
- Mark as New
- Bookmark
- Subscribe
- Mute
- Subscribe to RSS Feed
- Permalink
- Report Inappropriate Content
You are correct, i recognize the 1639. My excel calculation was wrong. Can you share the qvw file, i will to understand how the expressions are written and learn from it.
I wanted to create KPI for this data, which should give me $ Mils, Per Product cost & % for Automotive PBT. Can you help on that as well?
I need your guidance on the following points as well
1. I have more products, but same logic. Can i append the new product data? or any better suggestions
2. Currently i have listed this month status alone, when i need to see other months data of same product. Is it OK to append or any recommendation from your side?
Thanks
Ramesh
- « Previous Replies
- Next Replies »