Unlock a world of possibilities! Login now and discover the exclusive benefits awaiting you.
- Qlik Community
- :
- All Forums
- :
- QlikView App Dev
- :
- Re: Suppliers contribution of a customers revenue.
- Subscribe to RSS Feed
- Mark Topic as New
- Mark Topic as Read
- Float this Topic for Current User
- Bookmark
- Subscribe
- Mute
- Printer Friendly Page
- Mark as New
- Bookmark
- Subscribe
- Mute
- Subscribe to RSS Feed
- Permalink
- Report Inappropriate Content
Suppliers contribution of a customers revenue.
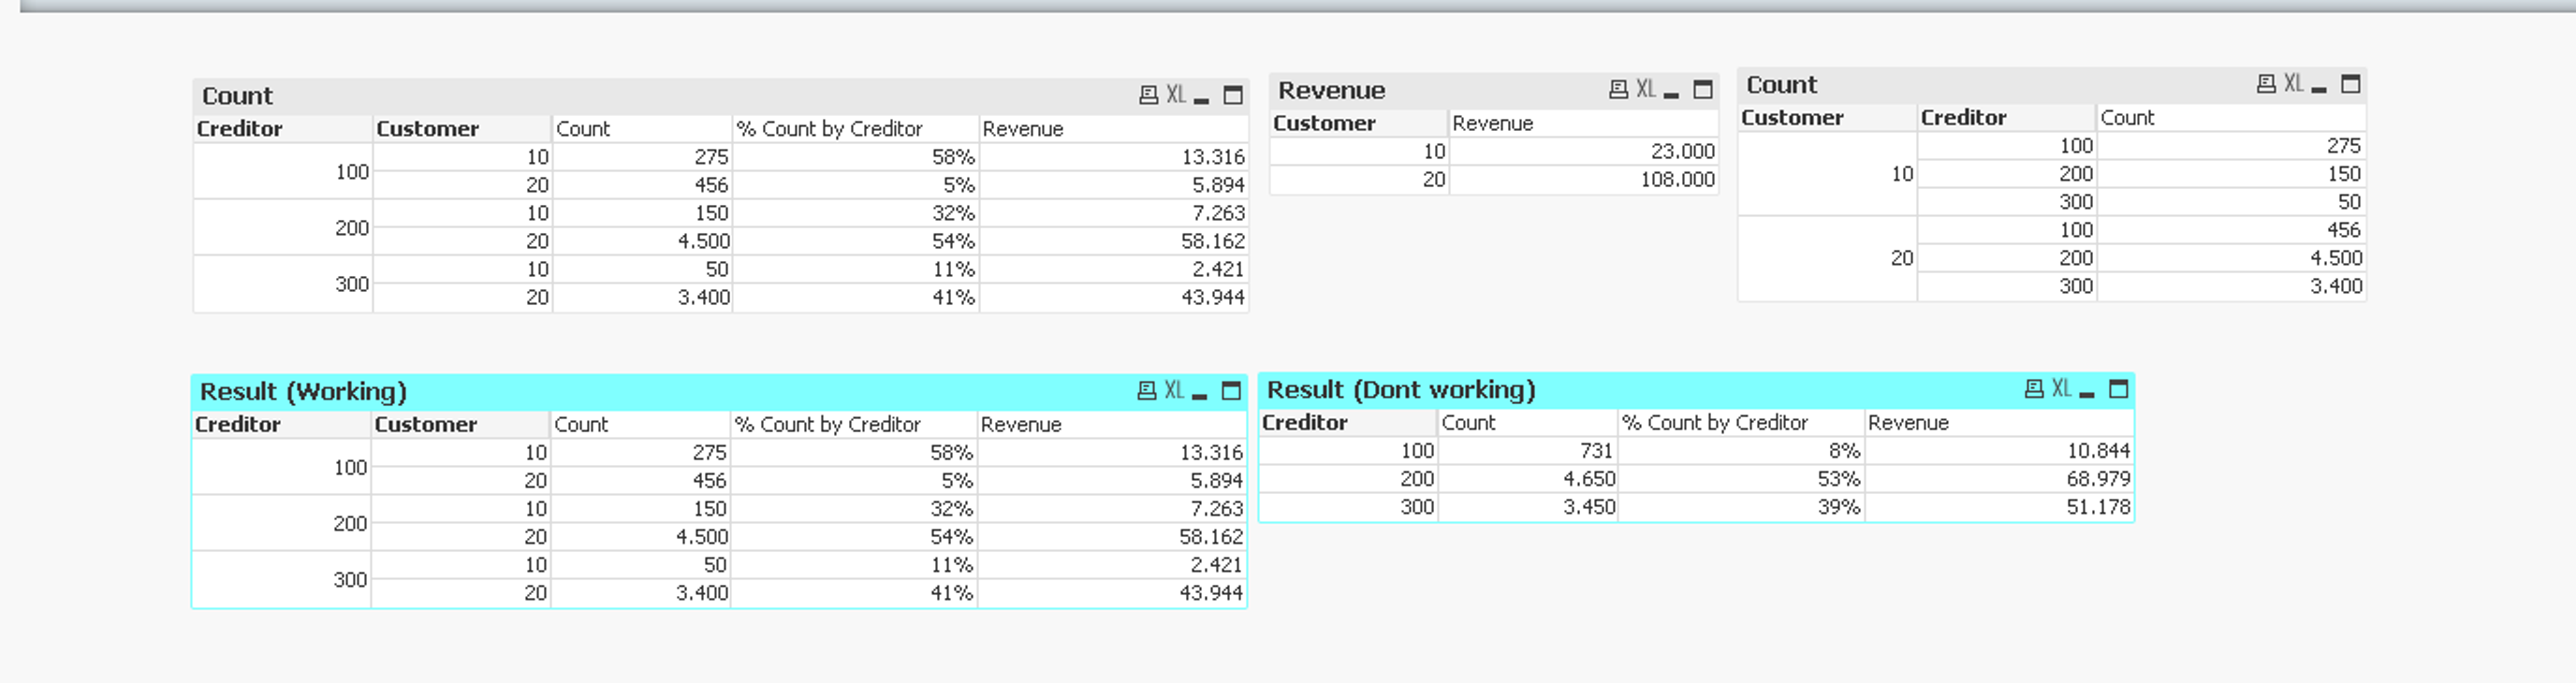
I have 2 Customers.
Customer 1 have 23000 in revenue and Customer 2 have 108.000 in revenue.
Supplier100 have contributed with 275 counts on customer 1 revenue.
Supplier100 have contributed with 456 counts on customer 2 revenue.
ETC.
I hope to show a chart only with suppliers as a dimension and then show the suppliers amount of the customers revenue.
When i remove the dimension customer in the chart it doesnt Work and have tried Aggr,Sum Total etc.
Supplier(Creditor) 100 shoul have 19000 in revenue in the right chart but only have 10.000
Any solutions
Will be very happy 🙂
Accepted Solutions
- Mark as New
- Bookmark
- Subscribe
- Mute
- Subscribe to RSS Feed
- Permalink
- Report Inappropriate Content
Hi, try using aggr by Creditor and Customer (document is attached)
- Mark as New
- Bookmark
- Subscribe
- Mute
- Subscribe to RSS Feed
- Permalink
- Report Inappropriate Content
Hi,
Supplier 100 has 731 counts from a total of 8831 counts. So 731 vs. 8831 is 8.27...%.
There is a total revenue of 131000 and 8.27....% of 131000 is 10843.73....
Could you give the calculation of the 19000 in your explenation ?
Kind regards,
Paul
- Mark as New
- Bookmark
- Subscribe
- Mute
- Subscribe to RSS Feed
- Permalink
- Report Inappropriate Content
Hi, try using aggr by Creditor and Customer (document is attached)
- Mark as New
- Bookmark
- Subscribe
- Mute
- Subscribe to RSS Feed
- Permalink
- Report Inappropriate Content
Just what i needed 🙂