Unlock a world of possibilities! Login now and discover the exclusive benefits awaiting you.
- Qlik Community
- :
- All Forums
- :
- QlikView App Dev
- :
- Swapping X and Y Axis on Graph
- Subscribe to RSS Feed
- Mark Topic as New
- Mark Topic as Read
- Float this Topic for Current User
- Bookmark
- Subscribe
- Mute
- Printer Friendly Page
- Mark as New
- Bookmark
- Subscribe
- Mute
- Subscribe to RSS Feed
- Permalink
- Report Inappropriate Content
Swapping X and Y Axis on Graph
Hello everyone,
I am currently trying to manipulate a line graph I have in Qlikview, to show a bit differently than it currently does. More specifically, I am trying to display the expressions that are showing on the Y-Axis, to show on the X-Axis. I have attached an image to this post showing what I currently have, and what I am trying to work towards.
Breaking it down, I have two dimensions (YYYYQ and the week # of the quarter). So for example, 201801 and the weeks 1-5. For my expressions, I have 5 (one expression for each week). The problem I have though, is that the expressions are loading vertically (on the y-axis), compared to what I want, horizontally (on the x-axis). What I would like to have, is each expression to show respectfully under its dimension name. For example, in the dimension field week # , Wk1, I want it to hold the expression calculated for week 1. Same goes for 2, 3, 4 etc.
Finally, the trend line should represent the dimension field YYYYQ (as can be seen in the attached image).
I'm not really sure on how to write this out in set analysis. I've tried doing IF Statements but that only gives me one week of the quarter, and forgets the rest. Do I need to work with calculated dimensions here, or is there another way I can do this? Is there a way I can set each week in week # to equal a specific expression calculation?
Thanks for any help!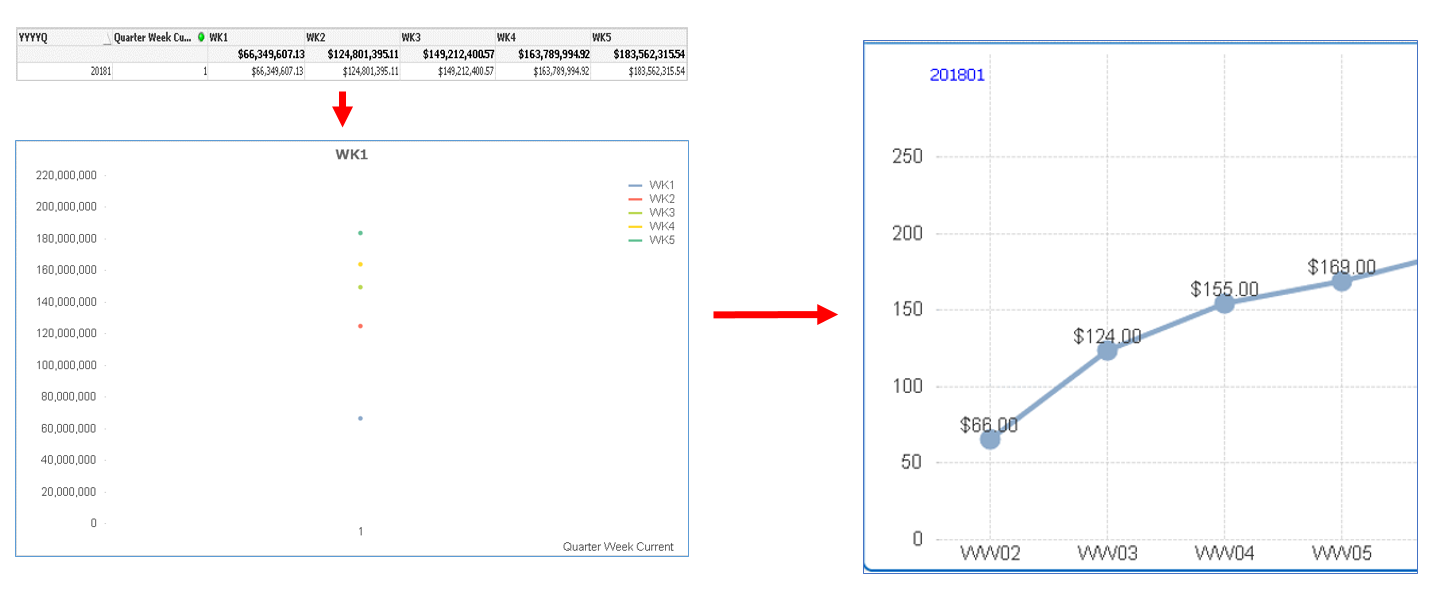
- Mark as New
- Bookmark
- Subscribe
- Mute
- Subscribe to RSS Feed
- Permalink
- Report Inappropriate Content
If your dimension values are limited, lets say 5, you may like to use synthetic dimension like below -
Valuelist('Wk1','Wk2','Wk3','Wk4','Wk5')
and your 5 expressions in the measure like this -
Pick(Match(Valuelist('Wk1','Wk2','Wk3','Wk4','Wk5'),'Wk1','Wk2','Wk3','Wk4','Wk5'),
Expressionforweek1,
Expressionforweek2,
Expressionforweek3,
Expressionforweek4,
Expressionforweek5)
- Mark as New
- Bookmark
- Subscribe
- Mute
- Subscribe to RSS Feed
- Permalink
- Report Inappropriate Content
Hi Digvijay,
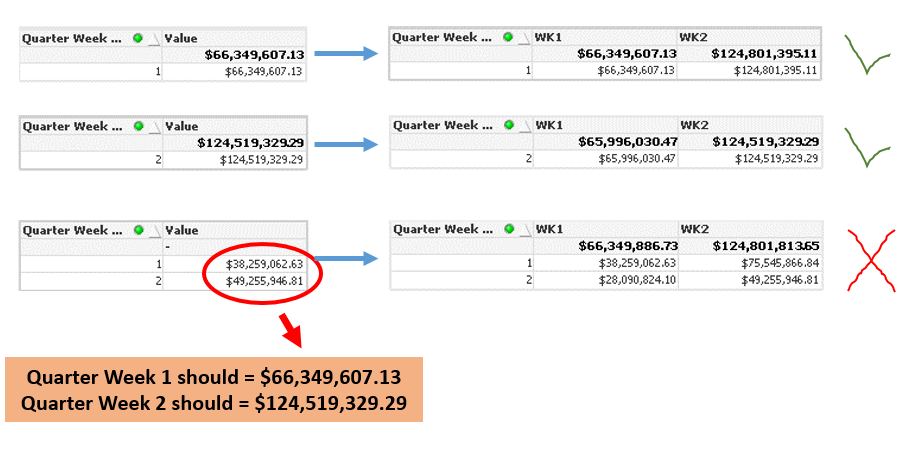
Thank you for your response. Your answer got me closer to what I'm looking for, but still not there yet. Using Pick/Match does give me the correct values when I select on that specific week number, but upon selecting say WK1 & WK 2 the values come back broken. I attached an image for your reference down below. What I'm working towards, is if I'm on WK1 & WK2 it should still hold those values.
Thanks!
- Mark as New
- Bookmark
- Subscribe
- Mute
- Subscribe to RSS Feed
- Permalink
- Report Inappropriate Content
Can you share dimension and expression you have used? Does Quarter Year represent Valuelist('Wk1','Wk2','Wk3','Wk4','Wk5') or its a different dimension?
- Mark as New
- Bookmark
- Subscribe
- Mute
- Subscribe to RSS Feed
- Permalink
- Report Inappropriate Content
If you can share sample data, I may try to tweak the expression. I wouldn't be able to use qvw as its unfortunate Qlik doesn't allow to access qvw without license. 
- Mark as New
- Bookmark
- Subscribe
- Mute
- Subscribe to RSS Feed
- Permalink
- Report Inappropriate Content
Hi Digvijay,
No problem. Quarter Year, or YYYYQ, represents the current year, and current quarter. For example, 201704, 201801, 201802, 201803, etc. This is not having any impact on the problem however.
The problem lies with my 2nd dimension, week # (WK1, WK2, WK3, WK4, WK5). As you may already know from my post above, the problem is that when I select more than one week, the values become distorted and incorrect.
Unfortunately, I cannot attach my exact expression syntax to this chain for proprietary reasons, but I did modify it to have the same idea behind it, and attached below. Essentially, in the match function looking at "1" the expression is if WK1 amt is greater than WK2 amt, take WK1 - WK2, otherwise 0. In the match function looking at '2', it would be if WK1 amt is greater than WK3 amt, take WK1 - WK3, otherwise 0.
Again, pick match does work when filtering on that specific week, but when I filter on more than one week, and in the week # field multiple wks start to show, it doesn't sum all the numbers together.
EXPRESSION (just testing with wks 1 & 2 right now)
Pick(Match(week #,'1','2'),
if(Sum({<week #={'2'}>}Amount)
<
(Sum({<week #={'1'}>}Amount)
,
(Sum({<week #={'1'}>}Amount)
-
(Sum({<week #={'2'}>}Amount),0)
,
if(Sum({<week #={'3'}>}Amount)
<
(Sum({<week #={'1'}>}Amount)
,
(Sum({<week #={'1'}>}Amount)
-
(Sum({<week #={'3'}>}Amount),0)
Thank you again for all your help!