Unlock a world of possibilities! Login now and discover the exclusive benefits awaiting you.
- Qlik Community
- :
- All Forums
- :
- QlikView App Dev
- :
- Re: Table Association
- Subscribe to RSS Feed
- Mark Topic as New
- Mark Topic as Read
- Float this Topic for Current User
- Bookmark
- Subscribe
- Mute
- Printer Friendly Page
- Mark as New
- Bookmark
- Subscribe
- Mute
- Subscribe to RSS Feed
- Permalink
- Report Inappropriate Content
Table Association
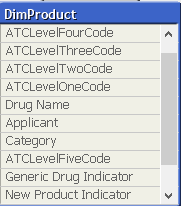
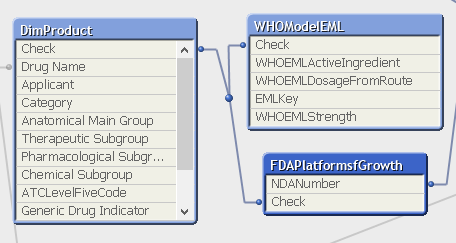
I have the following four main tables:
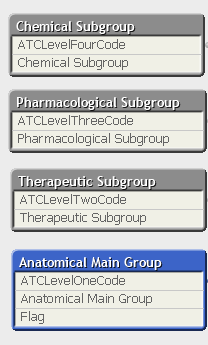
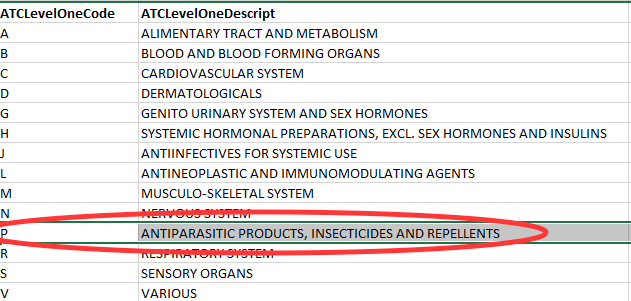
The above key table comprise a key (relevant code) together with a description of the relevant code.
My model also has the following tables:
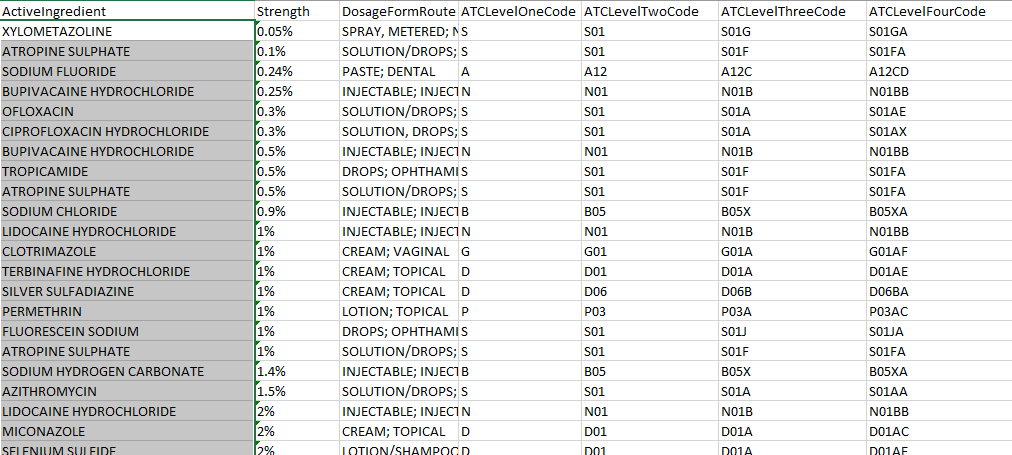
The above table is called WHOEML
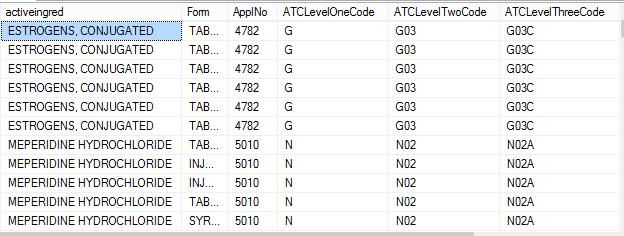
The last table is called FDATherapy and is as follows:
What would be the best method to associate these tables with no synthetic keys? As mentioned the first four tables are the key tables with the descriptions of the codes.
Regards
Chris
Accepted Solutions
- Mark as New
- Bookmark
- Subscribe
- Mute
- Subscribe to RSS Feed
- Permalink
- Report Inappropriate Content
Just something to start with (since the data model should also be designed to support your analysis best):
1) JOIN or ApplyMap the four Code tables to DimProduct (hence these four tables are removed from the data model afterwards)
2) Create a key field in DimProduct from the four Codes, e.g. using AutonumberXXX()
3) Create a key field in WHOEML table from the Code fields, then remove the Code fields from that table
4) Create a key field in FDATherapy table from the Code fields, then remove the Code fields from that table
Now you should have three tables, DimProduct, WHOEML and FDATherapy linked by the key created from Codes
Hope this helps,
Stefan
- Mark as New
- Bookmark
- Subscribe
- Mute
- Subscribe to RSS Feed
- Permalink
- Report Inappropriate Content
Thanks Stefan
What would be the 'search value(s)' in the source table?
Regards
- Mark as New
- Bookmark
- Subscribe
- Mute
- Subscribe to RSS Feed
- Permalink
- Report Inappropriate Content
Not sure what you mean with that. Are you referring to my proposal?
Which part of it?
- Mark as New
- Bookmark
- Subscribe
- Mute
- Subscribe to RSS Feed
- Permalink
- Report Inappropriate Content
Yes, let me try it out and will come back to you
- Mark as New
- Bookmark
- Subscribe
- Mute
- Subscribe to RSS Feed
- Permalink
- Report Inappropriate Content
Thanks Stefan
Model is now as follows:
The other 4 tables have been dropped as i used ApplyMap. However, in one of my chart reports i get the following:
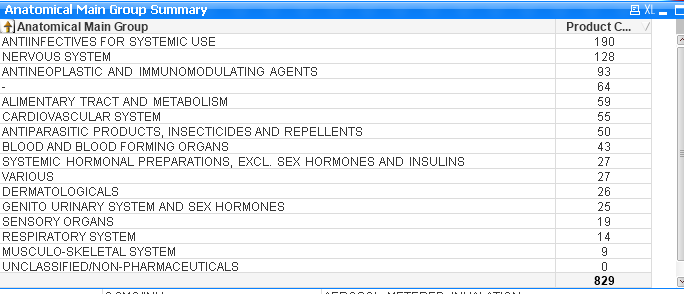
I am not sure why i get the blank row under the Anatomical Main Group field (4TH ROW). Also do not want the 'UNCLASSIFIED/NON-PHARMACEUTICALS IN THE LAST ROW TO APPEAR IN THE CHART.
REGARDS
- Mark as New
- Bookmark
- Subscribe
- Mute
- Subscribe to RSS Feed
- Permalink
- Report Inappropriate Content
You probably get a blank dimension in one row because your measure is not linked to Anatomical Main Group in some cases.
On the other hand, the last row shows zero for UNCLASSIFIED, because you don't have any entries in your measure table for this dimension value.
Does this make sense?
If appropriate you can filter these lines out using 'Suppress zero values' on presentation tab and 'Suppress When NULL' on dimension tab. Or you might want to find out why there is no relation in your data for these key values.
Regards,
Stefan
- Mark as New
- Bookmark
- Subscribe
- Mute
- Subscribe to RSS Feed
- Permalink
- Report Inappropriate Content
Thanks Stefan
I was doing some troubleshooting in order to find out the root cause of the blanks. I ran the model for the specify chart which had a blank and left our other irrelevant tables as follows:
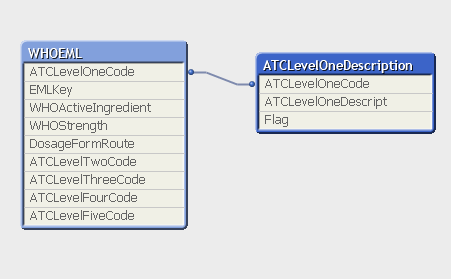
The two tables are as follows
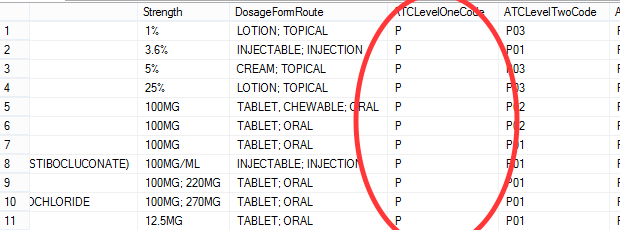
The report which i ran is as follows:
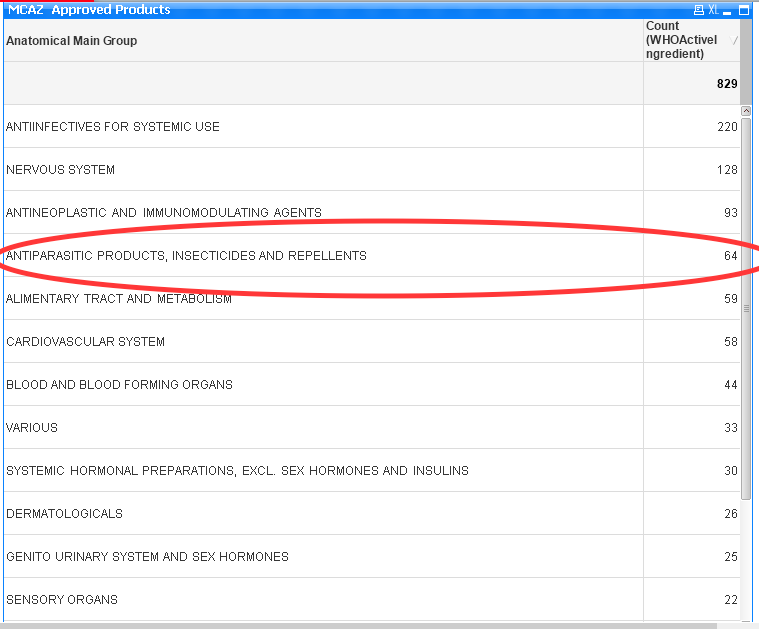
I then realised that the blank in the full report as given above where we used ApplyMap, was coming from the red circled Anatomical Main Group 'ANTIPARASITIC PRODUCTS, INSECTICIDES AND REPELLENTS', see below:
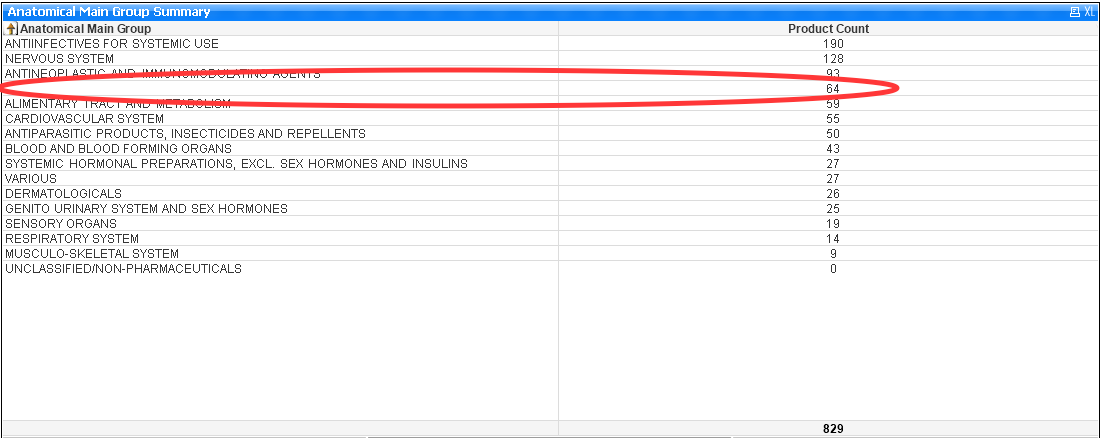
The above shows the blank in the full model. So what this means is that the association done is not working as it should be.
Regards