Unlock a world of possibilities! Login now and discover the exclusive benefits awaiting you.
- Qlik Community
- :
- All Forums
- :
- QlikView App Dev
- :
- Table help
- Subscribe to RSS Feed
- Mark Topic as New
- Mark Topic as Read
- Float this Topic for Current User
- Bookmark
- Subscribe
- Mute
- Printer Friendly Page
- Mark as New
- Bookmark
- Subscribe
- Mute
- Subscribe to RSS Feed
- Permalink
- Report Inappropriate Content
Table help
Hello,
Looking for some help to correct a table. Originally I was using YTD data, and using set analysis to lock onto one month. After a change from the users, I have been given MTD data. I am no longer using Month in my set analysis, but I would like the current month if no selection to show under month. If a month is selected, I would like that to show, with the data showing YTD through that month.
Is this possible?
Here is a picture of the table:
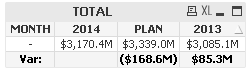
Since I am using Dimensionality as a way to show the variance below, I need a way to create different rows. Another way to create variance below the sales of the month would be fine as well.
Here is a sample of the code:
=
if ( Dimensionality()=0,
((sum({<[NEW RENEW IND]={'COMBINED'}, YEAR={$(vBusinessYear)}>}[SALES])/1000000)-
(sum({<[NEW RENEW IND]={'COMBINED'}, YEAR={'PLAN'}>}[SALES])/1000000)),
sum({<[NEW RENEW IND]={'COMBINED'}, YEAR={'PLAN'}>}[SALES])/1000000)
Thank you for the help,
Justin