Unlock a world of possibilities! Login now and discover the exclusive benefits awaiting you.
- Qlik Community
- :
- All Forums
- :
- QlikView App Dev
- :
- Re: Text as popup causing extra data points to app...
- Subscribe to RSS Feed
- Mark Topic as New
- Mark Topic as Read
- Float this Topic for Current User
- Bookmark
- Subscribe
- Mute
- Printer Friendly Page
- Mark as New
- Bookmark
- Subscribe
- Mute
- Subscribe to RSS Feed
- Permalink
- Report Inappropriate Content
Text as popup causing extra data points to appear
Hi there,
I am using the trick described here: Pop up Text with more information to have some additional pop-up information when people mouse over the bar chart. For some reason though, when I enable this extra expression it causes extra data points to show up even though there is no data for it.

Here you can see the graph with the extra data points. They don't have any data like "DVHPYSN" does, but are still shown.
Does anyone have any ideas as to why this is happening?
Thanks for any help!
- « Previous Replies
-
- 1
- 2
- Next Replies »
- Mark as New
- Bookmark
- Subscribe
- Mute
- Subscribe to RSS Feed
- Permalink
- Report Inappropriate Content
Use an if statement to display the pop-up information only when a data point exists. Assuming your first expression is the data point, you can try this
If(Len(Trim(Column(1)) > 0, Popup Text Expression)
- Mark as New
- Bookmark
- Subscribe
- Mute
- Subscribe to RSS Feed
- Permalink
- Report Inappropriate Content
Hi Sunny,
Thanks for your help.
I did that but I'm getting an error in my expression.
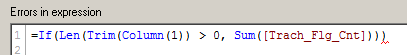
I tried messing around with it a little but couldn't figure out where it's getting the error.
- Mark as New
- Bookmark
- Subscribe
- Mute
- Subscribe to RSS Feed
- Permalink
- Report Inappropriate Content
Is this the expression for your text popup? Also, you have an extra parenthesis at the end also
- Mark as New
- Bookmark
- Subscribe
- Mute
- Subscribe to RSS Feed
- Permalink
- Report Inappropriate Content
My expression for the popup has some set analysis in it, so I am just using this to make it easier when asking for advice.
And I'm not sure on the parenthesis. When I remove the last one, the edit expression box turns the parenthesis next to If red, indicating it's missing one.
- Mark as New
- Bookmark
- Subscribe
- Mute
- Subscribe to RSS Feed
- Permalink
- Report Inappropriate Content
You need another parenthesis after Column(1))) to close for Len() function 
- Mark as New
- Bookmark
- Subscribe
- Mute
- Subscribe to RSS Feed
- Permalink
- Report Inappropriate Content
I just copied and pasted what you wrote out! So I'm still blaming you. =0)
So it's sort of working now.
If I have just an expression in there, the popup text works and there are no extra data points. But if I add text to it, the data points come back.
So
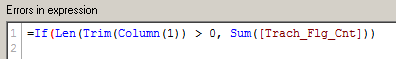
This works - If(Len(Trim(Column(1)) > 0, Sum([Trach_Flg_Cnt]))
But if I add some text to it like If(Len(Trim(Column(1)) > 0, 'Trach Flag Count = ' & Sum([Trach_Flg_Cnt])) ,then it adds those random data points again.
- Mark as New
- Bookmark
- Subscribe
- Mute
- Subscribe to RSS Feed
- Permalink
- Report Inappropriate Content
That was my bad ... try this
If(Len(Trim(Column(1))) > 0, 'Trach Flag Count = ' & Sum([Trach_Flg_Cnt]))
- Mark as New
- Bookmark
- Subscribe
- Mute
- Subscribe to RSS Feed
- Permalink
- Report Inappropriate Content
Oops, see I missed the parenthesis there too. Now we're even.... =P
That is what I have. With the 'Trach Flag Count = ' the extra data points come back, but without it, they don't.
It's pretty weird....
- Mark as New
- Bookmark
- Subscribe
- Mute
- Subscribe to RSS Feed
- Permalink
- Report Inappropriate Content
That is weird, have you made sure that 'Suppress Zero Values' is checked on the presentation tab of the chart properties?
- « Previous Replies
-
- 1
- 2
- Next Replies »