Unlock a world of possibilities! Login now and discover the exclusive benefits awaiting you.
- Qlik Community
- :
- All Forums
- :
- QlikView App Dev
- :
- Token Doesn't Match - Count(RangeSum & Several If ...
- Subscribe to RSS Feed
- Mark Topic as New
- Mark Topic as Read
- Float this Topic for Current User
- Bookmark
- Subscribe
- Mute
- Printer Friendly Page
- Mark as New
- Bookmark
- Subscribe
- Mute
- Subscribe to RSS Feed
- Permalink
- Report Inappropriate Content
Token Doesn't Match - Count(RangeSum & Several If Statements
Afternoon All,
Receiving an error ("Token doesn't match") when attempting to use the below Expression:
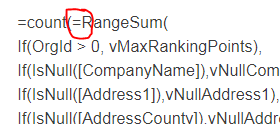
=count(=RangeSum(
If(OrgId > 0, vMaxRankingPoints),
If(IsNull([CompanyName]),vNullCompanyName),
If(IsNull([Address1]),vNullAddress1),
If(IsNull([AddressCounty]),vNullAddressCounty),
If(IsNull([AddressPostcode]),vNullAddressPostcode),
If(IsNull([AddressTown]),vNullAddressTown),
If(IsNull([Tel1]),vNullTelephone),
If(IsNull([modeled_turnover_band_desc]),vNullTurnover),
If(IsNull([WWW]),vNullWebsite),
If(Max([ActionDateStart]) <= Date(Today()-90), vNoContactOver90Days),
If(Max([ActionDateStart]) <= Date(Today()-365), vNoContactOver365Days)))
The Range Sum & all the if statements give me an end results depending on what the OrgId contains.
So vMaxRankingPoints is set at 100 & the other variables are negative points which gives a result at the end.
Example - Telephone number is missing, so minus 10 points from the vMaxRankingPoints.
I then want to group these using the Count Function;
So I would end up with a result like, 520 Org Ids have a ranking of 75, 202 ranking of 100, 1300 ranking of 80 etc.
Any ideas would be appreciated.
Please note that removing "Count" does give me results of the final score per OrgID, so I am only really looking for a fix for the start.
Accepted Solutions
- Mark as New
- Bookmark
- Subscribe
- Mute
- Subscribe to RSS Feed
- Permalink
- Report Inappropriate Content
Craig,
Have a look at what I've done here. It may be close to what you are wanting. I've added a calculated dimension to the chart to assist in the look.
Thanks
Oscar
- Mark as New
- Bookmark
- Subscribe
- Mute
- Subscribe to RSS Feed
- Permalink
- Report Inappropriate Content
Not sure if I completely understand the issue, but have you tried to remove the equal sign before RangeSum?
- Mark as New
- Bookmark
- Subscribe
- Mute
- Subscribe to RSS Feed
- Permalink
- Report Inappropriate Content
Hi Sunny,
Thanks for the quick response; unfortunately removing the = Sign as highlighted just gives 'Error In Expression'
- Mark as New
- Bookmark
- Subscribe
- Mute
- Subscribe to RSS Feed
- Permalink
- Report Inappropriate Content
Craig,
It sounds like you want to do something like the following:
=Sum(
Aggr(
RangeSum(
If(OrgID > 0, vMaxRankingPoints),
If(IsNull([Company Name]),vNullCompanyName),
If(IsNull([Address1]),vNullAddress1),
If(IsNull([Address County]),vNullAddressCounty),
If(IsNull([Address Postcode]),vNullAddressPostcode),
If(IsNull([Address Town]),vNullAddressTown),
If(IsNull([Tel1]),vNullTelephone),
If(IsNull([modeled_turnover_band_desc]),vNullTurnover),
If(IsNull([WWW]),vNullWebsite),
If(Max([ActionDateStart]) <= Date(Today()-90), vNoContactOver90Days),
If(Max([ActionDateStart]) <= Date(Today()-365), vNoContactOver365Days)
), OrgID
)
)
You can't nest aggregations without using the AGGR function. I used SUM instead of COUNT as the count will return the number of OrgID's as where the sum will return the summarized totals.
Good Luck
Oscar
- Mark as New
- Bookmark
- Subscribe
- Mute
- Subscribe to RSS Feed
- Permalink
- Report Inappropriate Content
I don't think that removing the = sign the cause of the problem -- I think the = sign is masking the error and removing the sign reveals the error. The = sign in that position is a syntax error itself (and you can't always rely on the syntax checker).
I expect that one of your variables is empty or has some content that is causing an error. The variables are expanded before the statement is parsed and executed.
- Mark as New
- Bookmark
- Subscribe
- Mute
- Subscribe to RSS Feed
- Permalink
- Report Inappropriate Content
Thanks for the tips Oscar,
I gave this a go and it worked in terms of giving me an overall total of all ranking points from all OrgIds.
My overall goal though is to have a bar chart that has:
y-axis displays OrgId Count
x-axis displays grouped rankings (points).
End result would hopefully look like the image below (but not as sketchy as mine  )
)
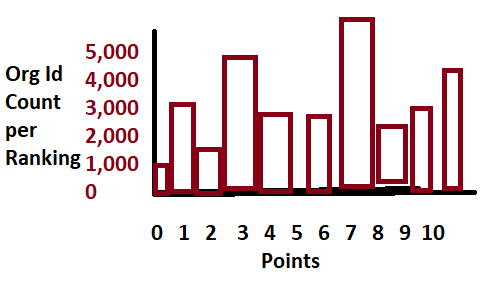
How would this be possible?
- Mark as New
- Bookmark
- Subscribe
- Mute
- Subscribe to RSS Feed
- Permalink
- Report Inappropriate Content
Thanks Jonathan, I thought the same thing but hadn't come accross the termonology of Token Error on Qlik before today
- Mark as New
- Bookmark
- Subscribe
- Mute
- Subscribe to RSS Feed
- Permalink
- Report Inappropriate Content
Craig,
Have a look at what I've done here. It may be close to what you are wanting. I've added a calculated dimension to the chart to assist in the look.
Thanks
Oscar
- Mark as New
- Bookmark
- Subscribe
- Mute
- Subscribe to RSS Feed
- Permalink
- Report Inappropriate Content
Hi Oscar
That's exactly what I was after!
Thank you,
Craig